| West Thornton | |
|---|---|
| ward for Croydon Council | |
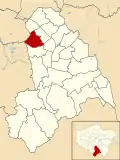 Boundary of West Thornton in Croydon from 2018. | |
| County | Greater London |
| Current ward | |
| Created | 1965 |
| Councillor | Janet Campbell (Labour) |
| Councillor | Stuart King (Labour) |
| Councillor | Chrishni Reshekaron (Labour) |
| Number of councillors | Three |
| UK Parliament constituency | Croydon North |
West Thornton is a ward in the London Borough of Croydon,[1][2] covering part of the Thornton Heath area. The first election held under the new ward boundaries was the 2018 Croydon Council election.
List of Councillors
| Election | Councillor | Party | Councillor | Party | Councillor | Party | |||||||
|---|---|---|---|---|---|---|---|---|---|---|---|---|---|
| 1965 | Ward created | ||||||||||||
| R. Tilbury | Conservative Resident | E. J. Fowler | Conservative Resident | E. F. A. Whitehorn | Conservative Resident | ||||||||
| 1971 | C. J. Mitchell | Labour | D. A. Herriott | Labour | A. J. Simanowitz | Labour | |||||||
| 1974 | S. J. Stewart | Conservative | D. R. Loughborough | Conservative | Mrs Yvonne A. L. Stewart | Conservative | |||||||
| 1978 | Ernest G. Noad | Conservative | Iris S. Rodda | Conservative | |||||||||
| 1982 | Eric W. Howell | Conservative | Anita C. Drummond-Brown | Conservative | |||||||||
| 1986 | Maggie R. Mansell | Labour | David R. Evans | Labour | Gee E. Bernard | Labour | |||||||
| 1990 | Clarence McKenzie | Labour | Elaine A. Gibbon | Labour | |||||||||
| 1998 | Raj Chandarana | Labour | |||||||||||
| 2002 | Bernadette Khan | Labour | Martin A. Tiedemann | Labour | |||||||||
| 2006 | Mike Mogul | Labour | |||||||||||
| 2008 | Conservative | ||||||||||||
| 2010 | Paul Smith | Labour | Humayun Kabir | Labour | |||||||||
| 2014 | Emily Benn | Labour | Stuart T. King | Labour | |||||||||
| 2016 | Callton Young | Labour | |||||||||||
| 2018 | Janet Campbell | Labour | |||||||||||
| 2022 | Chrishni Reshekaron | Labour | |||||||||||
Mayoral election results
Below are the results for the candidate which received the highest share of the popular vote in the ward at each mayoral election.
| Year | Mayoral candidate | Party | Winner? | |
|---|---|---|---|---|
| 2022 | Val Shawcross | Labour | ||
Ward Results
| Party | Candidate | Votes | % | ±% | |
|---|---|---|---|---|---|
| Labour | Janet Campbell* | 1,896 | |||
| Labour | Stuart King* | 1,755 | |||
| Labour | Chrishni Reshekaron | 1,684 | |||
| Conservative | Patrick Ratnaraja | 818 | |||
| Conservative | Tom Lott | 803 | |||
| Conservative | Abdul Talukdar | 595 | |||
| Green | Barry Buttigieg | 418 | |||
| Green | Rosalyn Mott | 407 | |||
| Taking the Initiative | Ben Andoh | 218 | |||
| Turnout | 3,408 | 27.15 | |||
| Labour hold | Swing | ||||
| Labour hold | Swing | ||||
| Labour hold | Swing | ||||
| Party | Candidate | Votes | % | ±% | |
|---|---|---|---|---|---|
| Labour | Janet Georgia Campbell | 2,978 | 27.54 | ||
| Labour | Bernadette Khan | 2,716 | 25.12 | ||
| Labour | Stuart Thomas King | 2,640 | 24.42 | ||
| Conservative | Dominic John Schofield | 653 | 6.04 | ||
| Conservative | Alasdair Stewart | 621 | 5.74 | ||
| Conservative | Matin Talukdar | 563 | 5.21 | ||
| Green | Eileen Diane Gale | 364 | 3.37 | ||
| Green | Barry Phillip Buttigieg | 278 | 2.57 | ||
| Majority | 1,987 | 18.38 | |||
| Turnout | |||||
| Labour hold | Swing | ||||
| Labour hold | Swing | ||||
| Labour hold | Swing | ||||
| Party | Candidate | Votes | % | ±% | |
|---|---|---|---|---|---|
| Labour | Callton Young | 3,136 | 64.7 | +2.0 | |
| Conservative | Scott Roche | 989 | 20.4 | +3.0 | |
| Green | David Beall | 289 | 6.0 | -2.5 | |
| UKIP | Ace Nnorom | 145 | 3.0 | -5.0 | |
| Liberal Democrats | Geoff Morley | 140 | 2.9 | -0.5 | |
| Independence from Europe | Peter Morgan | 77 | 1.6 | N/A | |
| English Democrat | Winston McKenzie | 70 | 1.4 | N/A | |
| Majority | 2,147 | 44.3 | |||
| Turnout | 44 | ||||
| Labour hold | Swing | ||||
The by-election was triggered by the resignation of Councillor Emily Benn to pursue a job in New York City, United States[4]
| Party | Candidate | Votes | % | ±% | |
|---|---|---|---|---|---|
| Labour | Emily Benn | 2,461 | |||
| Labour | Bernadette Khan | 2,371 | |||
| Labour | Stuart King | 2,243 | |||
| Conservative | Florence Evans | 684 | |||
| Conservative | Samir Dwesar | 650 | |||
| Conservative | Patrick Ratnaraja | 595 | |||
| Green | David Beall | 331 | |||
| UKIP | William Thomas | 312 | |||
| UKIP | Marjorie Bissick | 298 | |||
| Green | Barry Buttigieg | 213 | |||
| Green | Rebecca Parnell | 207 | |||
| Liberal Democrats | Patricia Knight | 134 | |||
| Majority | |||||
| Turnout | |||||
| Labour hold | Swing | ||||
| Labour hold | Swing | ||||
| Labour hold | Swing | ||||
| Party | Candidate | Votes | % | ±% | |
|---|---|---|---|---|---|
| Labour | Paul Smith | 3,736 | |||
| Labour | Bernadette Khan | 3,694 | |||
| Labour | Humayun Kabir | 3,658 | |||
| Conservative | Simon Brew | 1,611 | |||
| Conservative | Jacqueline Purcell | 1,486 | |||
| Conservative | Selva Jeyadeva | 1,418 | |||
| Liberal Democrats | Lucy N. Njomo | 958 | |||
| Green | David T. Beall | 620 | |||
| Green | Kiran J. Datta | 392 | |||
| Green | Barry Buttigieg | 345 | |||
| Communist | Ben Stevenson | 80 | |||
| Turnout | 6,656 | 57.6 | |||
| Registered electors | 11,547 | ||||
| Labour hold | Swing | ||||
| Labour hold | Swing | ||||
| Labour hold | Swing | ||||
| Party | Candidate | Votes | % | ±% | |
|---|---|---|---|---|---|
| Labour | Raj Chandarana | 1,660 | |||
| Labour | Bernadette Khan | 1,521 | |||
| Labour | Mike Mogul | 1,387 | |||
| Conservative | Christina Blair | 1,115 | |||
| Conservative | Mehmet Bezginsoy | 919 | |||
| Conservative | Bilgin Duven | 916 | |||
| Liberal Democrats | Mahmud Ahsanollah | 590 | |||
| Green | Santheya Natarajan | 539 | |||
| Turnout | 3,386 | 31.4% | |||
| Registered electors | 10,790 | ||||
| Labour hold | Swing | ||||
| Labour hold | Swing | ||||
| Labour hold | Swing | ||||
| Party | Candidate | Votes | % | ±% | |
|---|---|---|---|---|---|
| Labour | Raj Chandarana | 1,691 | |||
| Labour | Bernadette Khan | 1,547 | |||
| Labour | Martin A. Tiedemann | 1,506 | |||
| Conservative | George A. Fibley | 704 | |||
| Conservative | Parshotam L. Bhagat | 675 | |||
| Conservative | Christopher P. Leese | 586 | |||
| Liberal Democrats | Saeed A. Malik | 313 | |||
| Liberal Democrats | Christopher A. Reilly | 306 | |||
| Liberal Democrats | Susan L. Watson | 296 | |||
| Majority | |||||
| Turnout | |||||
| Labour hold | Swing | ||||
| Labour hold | Swing | ||||
| Labour hold | Swing | ||||
| Party | Candidate | Votes | % | ±% | |
|---|---|---|---|---|---|
| Labour | Clarence A. McKenzie | 1,449 | |||
| Labour | Gwendolyn E. Bernard | 1,408 | |||
| Labour | Raj Chandarana | 1,363 | |||
| Conservative | Roger C. Taylor | 913 | |||
| Conservative | Parshotam L. Bhagat | 868 | |||
| Conservative | Vinita Bearman | 815 | |||
| Majority | |||||
| Turnout | |||||
| Registered electors | |||||
| Labour hold | Swing | ||||
| Labour hold | Swing | ||||
| Labour hold | Swing | ||||
| Party | Candidate | Votes | % | ±% | |
|---|---|---|---|---|---|
| Labour | Elaine A. Gibbon | 2,354 | |||
| Labour | Clarence A. McKenzie | 2,284 | |||
| Labour | Gwendolyn E. Bernard | 2,230 | |||
| Conservative | Alan E. Aylmer | 1,152 | |||
| Conservative | Roger C. Taylor | 1,115 | |||
| Conservative | Eileen P. Seaborn | 1,075 | |||
| Liberal Democrats | Henry Russell | 564 | |||
| Majority | 1,078 | ||||
| Turnout | |||||
| Registered electors | |||||
| Labour hold | Swing | ||||
| Labour hold | Swing | ||||
| Labour hold | Swing | ||||
| Party | Candidate | Votes | % | ±% | |
|---|---|---|---|---|---|
| Labour | Gwendolyn E. Bernard | 2,246 | |||
| Labour | Clarence A. McKenzie | 2,145 | |||
| Labour Co-op | Elaine A. Gibbon | 1,809 | |||
| Conservative | Alan E. Aylmer | 1,445 | |||
| Conservative | Sarah M. Pelling | 1,306 | |||
| Conservative | Yvonne A. L. Stewart | 1,225 | |||
| Liberal Democrats | Simon L. Held | 631 | |||
| Majority | 364 | ||||
| Turnout | |||||
| Registered electors | |||||
| Labour hold | Swing | ||||
| Labour hold | Swing | ||||
| Labour Co-op hold | Swing | ||||
| Party | Candidate | Votes | % | ±% | |
|---|---|---|---|---|---|
| Labour | Margaret R. Mansell | 1,954 | |||
| Labour | David R. Evans | 1,932 | |||
| Labour | Gwendolyn E. Bernard | 1,834 | |||
| Conservative | Stephen J. Stewart | 1,386 | |||
| Conservative | Eric W. Howell | 1,357 | |||
| Conservative | Yvonne A. L. Stewart | 1,320 | |||
| Liberal | Janet R. Pitt | 922 | |||
| Alliance | Alan J. Holder | 823 | |||
| Alliance | Graham F. Williams | 763 | |||
| Majority | 448 | ||||
| Turnout | |||||
| Registered electors | |||||
| Labour gain from Conservative | Swing | ||||
| Labour gain from Conservative | Swing | ||||
| Labour gain from Conservative | Swing | ||||
| Party | Candidate | Votes | % | ±% | |
|---|---|---|---|---|---|
| Conservative | Eric W. Howell | 1,771 | |||
| Conservative | Yvonne A. L. Stewart | 1,738 | |||
| Conservative | Anita C. Drummond-Brown | 1,715 | |||
| Labour | Margaret R. Mansell | 1,310 | |||
| Alliance | Alan R. Mead | 1,170 | |||
| Labour | James J. Penman | 1,135 | |||
| Alliance | Peter R. Norwood | 1,090 | |||
| Labour | Arnold J. Simanwitz | 1,044 | |||
| Alliance | David R. Dayus | 1,017 | |||
| Majority | 405 | ||||
| Turnout | |||||
| Registered electors | |||||
| Conservative hold | Swing | ||||
| Conservative hold | Swing | ||||
| Conservative hold | Swing | ||||
| Party | Candidate | Votes | % | ±% | |
|---|---|---|---|---|---|
| Conservative | Yvonne A. L. Stewart | 2,017 | |||
| Conservative | Ernest G. Noad | 1,923 | |||
| Conservative | Iris S. Rodda | 1,878 | |||
| Labour | Stanley J. Boden | 1,788 | |||
| Labour | Michael P. Rix | 1,733 | |||
| Labour Co-op | Bernadette R. Supiramaniam | 1,457 | |||
| Liberal | William H. Pitt | 490 | |||
| Liberal | Janet R. Pitt | 452 | |||
| Liberal | David R. Dayus | 388 | |||
| Majority | 90 | ||||
| Turnout | |||||
| Registered electors | |||||
| Conservative hold | Swing | ||||
| Conservative hold | Swing | ||||
| Conservative hold | Swing | ||||
| Party | Candidate | Votes | % | ±% | |
|---|---|---|---|---|---|
| Conservative | S. J. Stewart | 1,613 | |||
| Conservative | D. R. Loughborough | 1,573 | |||
| Conservative | Mrs Y. A. L. Stewart | 1,536 | |||
| Labour | D. A. Herriott | 1,464 | |||
| Labour | M. P. Rix | 1,439 | |||
| Labour | Mrs E. E. Daisley | 1,418 | |||
| Liberal | R. M. Greenhalgh | 725 | |||
| Liberal | J. A. Pile-Gray | 639 | |||
| Liberal | R. G. Rawcliffe | 623 | |||
| Majority | 72 | ||||
| Turnout | 37.0 | ||||
| Registered electors | 10,570 | ||||
| Conservative gain from Labour | Swing | ||||
| Conservative gain from Labour | Swing | ||||
| Conservative gain from Labour | Swing | ||||
| Party | Candidate | Votes | % | ±% | |
|---|---|---|---|---|---|
| Labour | C. J. Mitchell | 2,333 | |||
| Labour | D. A. Herriott | 2,229 | |||
| Labour | A. J. Simanowitz | 2,198 | |||
| Conservative | R. Tilbury | 1,865 | |||
| Conservative | S. J. Stewart | 1,838 | |||
| Conservative | E. J. Fowler | 1,835 | |||
| Turnout | 40.1 | ||||
| Registered electors | 10,760 | ||||
| Labour gain from Conservative Resident | Swing | ||||
| Labour gain from Conservative Resident | Swing | ||||
| Labour gain from Conservative Resident | Swing | ||||
| Party | Candidate | Votes | % | ±% | |
|---|---|---|---|---|---|
| Conservative Resident | R. Tilbury | 2,533 | |||
| Conservative Resident | E.F.A. Whitehorn | 2,491 | |||
| Conservative Resident | E.J. Fowler | 2,487 | |||
| Labour | Miss L.L. Scott | 769 | |||
| Labour | G.E. Mitchell | 740 | |||
| Labour | G.A. Bristow | 719 | |||
| Turnout | 32.4 | ||||
| Registered electors | 10,526 | ||||
| Conservative Resident hold | Swing | ||||
| Conservative Resident hold | Swing | ||||
| Conservative Resident hold | Swing | ||||
| Party | Candidate | Votes | % | ±% | |
|---|---|---|---|---|---|
| Conservative Resident | R. Tilbury | 2,348 | |||
| Conservative Resident | E. J. Fowler | 2,346 | |||
| Conservative Resident | E. F. A. Whitehorn | 2,346 | |||
| Labour | Miss L. L. Scott | 2,263 | |||
| Labour | T. Harris | 2,127 | |||
| Labour | F. Bailey | 2,125 | |||
| Turnout | 4,708 | 43.6 | |||
| Registered electors | 11,632 | ||||
| Conservative Resident win (new seat) | |||||
| Conservative Resident win (new seat) | |||||
| Conservative Resident win (new seat) | |||||
References
- ↑ "Final recommendations on the new electoral arrangements for Croydon Borough of Croydon" (PDF). Retrieved 10 April 2018.
- ↑ legislation.gov.uk -The London Borough of Croydon (Electoral Changes) Order 2017. Retrieved on 10 April 2018.
- ↑ "West Thornton 2022 election results | Croydon Council". www.croydon.gov.uk. Retrieved 8 May 2022.
- 1 2 "Archived copy". Archived from the original on 12 May 2017. Retrieved 8 August 2016.
{{cite web}}: CS1 maint: archived copy as title (link)
This article is issued from Wikipedia. The text is licensed under Creative Commons - Attribution - Sharealike. Additional terms may apply for the media files.