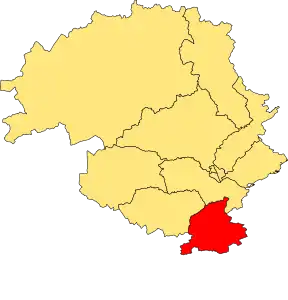
Location of the ward [1]
Kinross-shire is one of the twelve wards used to elect members of the Perth and Kinross Council. It elects four Councillors.
Councillors
| Election | Councillors | |||||||
|---|---|---|---|---|---|---|---|---|
| 2007 | Sandy Miller (SNP) |
Willie Robertson (Liberal Democrats) |
Michael Barnacle (Liberal Democrats /Ind.) |
Kathleen Baird (Conservative) | ||||
| 2012 | Joe Giacopazzi (SNP) |
Dave Cuthbert (Ind.) | ||||||
| 2017 | Richard Watters (SNP) |
Callum Purves (Conservative) | ||||||
| 2022 | Dave Cuthbert (Ind.) |
Neil Freshwater (Conservative) | ||||||
Election Results
2022 Election
2022 Perth and Kinross Council election[2]
| Party | Candidate | FPv% | Count | |||||||
|---|---|---|---|---|---|---|---|---|---|---|
| 1 | 2 | 3 | 4 | 5 | 6 | 7 | ||||
| SNP | Richard Watters (incumbent) | 25.47% | 1,638 | |||||||
| Liberal Democrats | Willie Robertson (incumbent) | 20.93% | 1,346 | |||||||
| Conservative | Neil Freshwater | 14.88% | 957 | 960.36 | 964.83 | 972.05 | 1,011.17 | 1,029.04 | 1,876.66 | |
| Conservative | George Stirling | 14.38% | 925 | 932.38 | 940.8 | 948.93 | 972.28 | 986.49 | ||
| Independent | Dave Cuthbert | 11.27% | 725 | 778.48 | 799.65 | 816.81 | 964.15 | 1,251.98 | 1,302.66 | |
| Labour | Graham Cox | 6.81% | 438 | 487 | 496.65 | 504.18 | ||||
| Scottish Green | Pat Doran | 5.15% | 331 | 517.84 | 525.9 | 532 | 658.81 | |||
| Scottish Family | Gerald O'Connell | 0.81% | 52 | 58.04 | 58.66 | |||||
| Electorate: 11,806 Valid: 6,432 Quota: 1,287 Turnout: 55.1% | ||||||||||
2017 Election
2017 Perth and Kinross Council election[3]
| Party | Candidate | FPv% | Count | |||||||
|---|---|---|---|---|---|---|---|---|---|---|
| 1 | 2 | 3 | 4 | 5 | 6 | 7 | ||||
| Conservative | Callum Purves | 26.73 | 1,642 | |||||||
| SNP | Richard Watters | 19.03 | 1,169 | 1,171.77 | 1,224.77 | 1,253.02 | ||||
| Liberal Democrats | Willie Robertson (incumbent) | 17.29 | 1,062 | 1,104.51 | 1,128.76 | 1,235.76 | ||||
| Independent | Mike Barnacle (incumbent) | 12.16 | 747 | 759.07 | 777.07 | 807.07 | 813.07 | 814.7 | 1,272.92 | |
| Independent | Dave Cuthbert (incumbent) | 9.77 | 600 | 618.86 | 637.12 | 689.37 | 695.79 | 698.03 | ||
| Conservative | John Ross | 7.96 | 489 | 803.91 | 807.15 | 831.18 | 832.08 | 833.3 | 907.43 | |
| Labour | David MacKenzie | 4.77 | 293 | 299.04 | 311.04 | |||||
| Scottish Green | Karen Grunwell | 2.31 | 142 | 143 | ||||||
| Electorate: TBC Valid: 6,144 Spoilt: 59 Quota: 1,229 Turnout: 6,203 (58.3%) | ||||||||||
2012 Election
2012 Perth and Kinross Council election[4]
| Party | Candidate | FPv% | Count | ||||||||
|---|---|---|---|---|---|---|---|---|---|---|---|
| 1 | 2 | 3 | 4 | 5 | 6 | 7 | 8 | ||||
| Independent | Dave Cuthbert | 19.31% | 897 | 905 | 915 | 964 | |||||
| Independent | Mike Barnacle (incumbent) | 17.27% | 802 | 819 | 828 | 859 | 871 | 905 | 924 | 930 | |
| Liberal Democrats | Willie Robertson (incumbent) | 16.99% | 789 | 807 | 857 | 902 | 910 | 947 | |||
| Conservative | Kathleen Baird (incumbent) | 14.98% | 696 | 701 | 707 | 723 | 726 | 733 | 739 | 743 | |
| SNP | Joe Giacopazzi | 14.04% | 652 | 658 | 664 | 685 | 689 | 1,009 | |||
| SNP | Sandy Miller (incumbent) | 8.45% | 411 | 417 | 418 | 434 | 436 | ||||
| Labour | Simon Edwin Bramwell | 4.95% | 230 | 241 | 246 | ||||||
| Liberal Democrats | Russell Auld | 1.87% | 87 | 91 | |||||||
| Scottish Green | Donald Fraser | 1.74% | 81 | ||||||||
| Electorate: - Valid: 4,645 Spoilt: 37 Quota: 930 Turnout: 4,682 (%) | |||||||||||
2007 Election
2007 Perth and Kinross Council election[5]
| Party | Candidate | FPv% | Count | |||||
|---|---|---|---|---|---|---|---|---|
| 1 | 2 | 3 | 4 | 5 | ||||
| SNP | Sandy Miller | 25.0 | 1,445 | |||||
| Liberal Democrats | Willie Robertson | 22.7 | 1,314 | |||||
| Conservative | Kathleen Baird | 21.0 | 1,217 | |||||
| Liberal Democrats | Michael Barnacle | 16.3 | 942 | 1,010 | 1,094 | 1,115 | 1,242 | |
| Labour | Kate Milliken | 11.2 | 650 | 692 | 713 | 717 | 774 | |
| Scottish Green | Andrew Thompson | 3.7 | 216 | 278 | 295 | 302 | ||
| Electorate: 9,664 Valid: 49 Spoilt: 5,784 Quota: 1,157 Turnout: 60.36% | ||||||||
References
- ↑ "5th Reviews - ward maps | Scottish Boundary Commission". lgbc-scotland.gov.uk. Retrieved 22 March 2020.
- ↑ "Perth and Kinross Council 2022". 8 May 2022.
- ↑ "Perth & Kinross Council - Local Government Elections results in 2017". pkc.gov.uk. Retrieved 22 March 2020.
- ↑ "Perth & Kinross Council - Local Government Elections results in 2012". pkc.gov.uk. Retrieved 22 March 2020.
- ↑ "Perth & Kinross Council - Election results". pkc.gov.uk. Retrieved 22 March 2020.
This article is issued from Wikipedia. The text is licensed under Creative Commons - Attribution - Sharealike. Additional terms may apply for the media files.