| Part of a series on the |
| COVID-19 pandemic |
|---|
 Scientifically accurate atomic model of the external structure of SARS-CoV-2. Each "ball" is an atom. |
|
|
|
This article contains the current number of confirmed COVID-19 deaths per population by country. It also has cumulative death totals by country. For these numbers over time see the tables, graphs, and maps at COVID-19 pandemic deaths and COVID-19 pandemic by country and territory.
This data is for entire populations, and does not reflect the differences in rates relative to different age groups. For example, in the United States as of 27 April 2021, the reported case fatality ratios were 0.015%, 0.15%, 2.3%, and 17% for the age groups 0–17, 18–49, 50–74, and 75 or over, respectively.[1]
Data reliability
Variation between testing programmes worldwide results in different ascertainment rates per country: not every SARS-CoV-2 infection, nor every COVID-19-related death, will be identified, while on the other hand some deaths may be wrongly attributed to COVID (for example if all suspected COVID deaths are counted as Covid deaths, as Belgium was doing in September 2020, or when for several months after April 2020, England reported all deaths after a positive COVID-19 test "in order to be sure not to underestimate the number of COVID-19 related deaths", while Scotland reported all deaths within 28 days of such a positive test).[2][3] Therefore, the true numbers of infections and deaths will exceed the observed (confirmed) numbers everywhere, though the extent will vary by country.[4] These statistics are therefore less suitable for between-country comparisons. As deaths are easier to identify than infections (which are regularly asymptomatic), the true case fatality rate (CFR) is likely lower than the observed CFR.
Causes of variation in true CFRs between countries, include variations in age and overall health of the population, medical care, and classification of deaths.[5]
Excess mortality statistics provide a more reliable estimate of all COVID-19-related mortality during the pandemic, though they include both "direct COVID-19 and indirect, non-COVID-19 deaths".[6] They compare overall mortality with that of previous years, and as such also include the potentially vast number of deaths among people with unconfirmed COVID-19. Data from Russia illustrates how the true death rates from COVID-19 can be far higher than visible from confirmed COVID-19 deaths: in December 2020, based on overall excess mortality during the year, total COVID-19 deaths in Russia were estimated to be over 186,000,[7] while confirmed COVID-19 deaths were at 56,271.[8] For the Netherlands, based on overall excess mortality, an estimated 20,000 people died from COVID-19 in 2020,[9] while only the death of 11,525 identified COVID-19 cases was registered.[8] The official count of COVID-19 deaths as of December 2021 is slightly more than 5.4 million, according to World Health Organization's report in May 2022. WHO also said that the real numbers are far higher than the official tally because of unregistered deaths in countries without adequate reporting.[10]
Table of total cases, deaths, and death rates by country
Note: Table is automatically updated daily.[note 1] Data source is Our World in Data.[note 2][note 3]
| Country | Deaths / million | Deaths | Cases |
|---|---|---|---|
| World[lower-alpha 1] | 875 | 6,985,265 | 772,051,988 |
| Peru | 6,507 | 221,564 | 4,520,102 |
| Bulgaria | 5,675 | 38,494 | 1,312,102 |
| Bosnia and Herzegovina | 5,062 | 16,369 | 403,355 |
| Hungary | 4,900 | 48,848 | 2,212,994 |
| North Macedonia | 4,756 | 9,958 | 349,868 |
| Croatia | 4,588 | 18,495 | 1,277,094 |
| Georgia | 4,575 | 17,132 | 1,855,289 |
| Slovenia | 4,475 | 9,487 | 1,347,064 |
| Montenegro | 4,232 | 2,654 | 251,280 |
| Czech Republic | 4,099 | 43,019 | 4,684,233 |
| Latvia | 4,005 | 7,412 | 976,798 |
| Slovakia | 3,750 | 21,167 | 1,868,801 |
| San Marino | 3,739 | 126 | 25,292 |
| Moldova | 3,713 | 12,154 | 627,458 |
| Greece | 3,646 | 37,869 | 5,464,525 |
| Lithuania | 3,549 | 9,761 | 1,350,542 |
| Romania | 3,488 | 68,590 | 3,501,193 |
| Gibraltar | 3,458 | 113 | 20,550 |
| United Kingdom | 3,438 | 232,112 | 24,812,582 |
| United States | 3,384 | 1,144,877 | 103,436,829 |
| Italy | 3,267 | 192,909 | 26,318,717 |
| Brazil | 3,260 | 702,116 | 37,519,960 |
| Chile | 3,159 | 61,937 | 5,315,963 |
| Armenia | 3,155 | 8,774 | 451,107 |
| Poland | 3,004 | 119,753 | 6,553,317 |
| Martinique | 3,003 | 1,104 | 230,354 |
| Belgium | 2,946 | 34,339 | 4,829,921 |
| Paraguay | 2,939 | 19,930 | 736,101 |
| Trinidad and Tobago | 2,867 | 4,390 | 191,496 |
| Argentina | 2,866 | 130,472 | 10,060,763 |
| European Union[lower-alpha 2] | 2,774 | 1,248,722 | 184,587,038 |
| Ukraine | 2,768 | 109,918 | 5,520,483 |
| Russia | 2,767 | 400,488 | 23,258,444 |
| Colombia | 2,751 | 142,727 | 6,383,595 |
| Aruba | 2,742 | 292 | 44,224 |
| Portugal | 2,697 | 27,702 | 5,631,629 |
| Serbia | 2,627 | 18,057 | 2,583,470 |
| Mexico | 2,626 | 334,910 | 7,702,310 |
| France | 2,599 | 167,985 | 38,997,490 |
| Guadeloupe | 2,579 | 1,021 | 203,235 |
| Bermuda | 2,569 | 165 | 18,860 |
| Spain | 2,562 | 121,852 | 13,980,340 |
| Austria | 2,520 | 22,534 | 6,081,287 |
| Guam | 2,427 | 417 | 52,187 |
| Sweden | 2,401 | 25,332 | 2,728,931 |
| Tunisia | 2,381 | 29,423 | 1,153,361 |
| Saint Lucia | 2,279 | 410 | 30,209 |
| Suriname | 2,271 | 1,404 | 82,506 |
| Uruguay | 2,236 | 7,656 | 1,040,596 |
| Liechtenstein | 2,210 | 87 | 21,526 |
| Estonia | 2,191 | 2,906 | 602,909 |
| French Polynesia | 2,118 | 649 | 78,700 |
| Barbados | 2,105 | 593 | 110,128 |
| Germany | 2,098 | 174,979 | 38,437,756 |
| Sint Maarten | 2,081 | 92 | 11,051 |
| Bahamas | 2,058 | 844 | 38,084 |
| British Virgin Islands | 2,042 | 64 | 7,392 |
| Ecuador | 2,001 | 36,034 | 1,064,192 |
| Lebanon | 1,994 | 10,947 | 1,239,904 |
| Andorra | 1,991 | 159 | 48,015 |
| Panama | 1,962 | 8,651 | 1,041,696 |
| Finland | 1,960 | 10,864 | 1,499,712 |
| Grenada | 1,897 | 238 | 19,693 |
| Republic of Ireland | 1,864 | 9,366 | 1,725,026 |
| Monaco | 1,836 | 67 | 17,181 |
| Bolivia | 1,833 | 22,407 | 1,209,626 |
| Puerto Rico | 1,825 | 5,938 | 1,252,713 |
| Montserrat | 1,812 | 8 | 1,403 |
| Costa Rica | 1,808 | 9,368 | 1,230,653 |
| Kosovo | 1,802 | 3,212 | 274,279 |
| Hong Kong | 1,798 | 13,466 | 2,876,106 |
| South Africa | 1,712 | 102,595 | 4,072,575 |
| Belize | 1,697 | 688 | 71,373 |
| Malta | 1,659 | 885 | 120,705 |
| Iran | 1,656 | 146,705 | 7,624,407 |
| Switzerland | 1,611 | 14,086 | 4,425,596 |
| Guyana | 1,606 | 1,299 | 73,673 |
| Seychelles | 1,605 | 172 | 51,058 |
| Namibia | 1,597 | 4,102 | 172,170 |
| Curaçao | 1,595 | 305 | 45,883 |
| Antigua and Barbuda | 1,556 | 146 | 9,106 |
| Luxembourg | 1,544 | 1,000 | 386,030 |
| Cyprus | 1,522 | 1,364 | 660,854 |
| Caribbean Netherlands | 1,515 | 41 | 11,922 |
| Denmark | 1,500 | 8,824 | 3,417,017 |
| Jersey | 1,453 | 161 | 66,391 |
| Collectivity of Saint Martin | 1,445 | 46 | 12,324 |
| Canada | 1,379 | 53,046 | 4,711,258 |
| Isle of Man | 1,372 | 116 | 38,008 |
| French Guiana | 1,356 | 413 | 98,041 |
| Israel | 1,344 | 12,707 | 4,841,772 |
| United States Virgin Islands | 1,326 | 132 | 25,389 |
| Netherlands | 1,308 | 22,986 | 8,620,051 |
| Jamaica | 1,269 | 3,588 | 156,546 |
| Albania | 1,267 | 3,604 | 334,090 |
| Jordan | 1,251 | 14,122 | 1,746,997 |
| Saint Vincent and the Grenadines | 1,192 | 124 | 9,674 |
| Turkey | 1,188 | 101,419 | 17,004,677 |
| Eswatini | 1,187 | 1,427 | 75,166 |
| Guatemala | 1,132 | 20,201 | 1,250,301 |
| Malaysia | 1,095 | 37,191 | 5,134,632 |
| Palestine | 1,087 | 5,708 | 703,228 |
| New Caledonia | 1,082 | 314 | 80,064 |
| Honduras | 1,065 | 11,114 | 472,743 |
| Botswana | 1,064 | 2,800 | 330,397 |
| Guernsey | 1,057 | 67 | 35,326 |
| Norway | 1,054 | 5,732 | 1,489,459 |
| Bahrain | 1,043 | 1,536 | 696,614 |
| Dominica | 1,017 | 74 | 16,027 |
| Oman | 1,011 | 4,628 | 399,449 |
| Azerbaijan | 1,000 | 10,367 | 834,135 |
| Kazakhstan | 983 | 19,072 | 1,502,857 |
| Saint Kitts and Nevis | 964 | 46 | 6,607 |
| Fiji | 951 | 885 | 69,047 |
| Réunion | 945 | 921 | 494,595 |
| Libya | 944 | 6,437 | 507,269 |
| Australia | 903 | 23,643 | 11,669,087 |
| Turks and Caicos Islands | 874 | 40 | 6,696 |
| Northern Mariana Islands | 827 | 41 | 14,334 |
| Mauritius | 811 | 1,055 | 311,465 |
| Sri Lanka | 773 | 16,886 | 672,629 |
| American Samoa | 767 | 34 | 8,359 |
| Cuba | 760 | 8,530 | 1,115,043 |
| Anguilla | 755 | 12 | 3,904 |
| Belarus | 746 | 7,118 | 994,037 |
| Taiwan | 739 | 17,672 | 9,970,937 |
| Cabo Verde | 701 | 416 | 64,474 |
| South Korea | 693 | 35,934 | 34,571,873 |
| Wallis and Futuna | 689 | 8 | 3,550 |
| New Zealand | 679 | 3,522 | 2,416,777 |
| Mongolia | 672 | 2,284 | 1,011,297 |
| El Salvador | 667 | 4,230 | 201,833 |
| Maldives | 603 | 316 | 186,694 |
| Japan | 602 | 74,694 | 33,803,572 |
| Kuwait | 602 | 2,570 | 666,529 |
| Indonesia | 587 | 161,918 | 6,813,429 |
| Philippines | 577 | 66,746 | 4,122,658 |
| Mayotte | 573 | 187 | 42,027 |
| Iraq | 570 | 25,375 | 2,465,545 |
| Federated States of Micronesia | 569 | 65 | 26,547 |
| Cayman Islands | 538 | 37 | 31,472 |
| Faroe Islands | 527 | 28 | 34,658 |
| Iceland | 498 | 186 | 209,328 |
| Palau | 497 | 9 | 6,249 |
| Thailand | 481 | 34,492 | 4,759,586 |
| Saint Barthélemy | 454 | 5 | 5,507 |
| Vietnam | 440 | 43,206 | 11,624,000 |
| Morocco | 435 | 16,297 | 1,277,746 |
| Marshall Islands | 408 | 17 | 16,138 |
| Nepal | 393 | 12,031 | 1,003,450 |
| Dominican Republic | 390 | 4,384 | 661,179 |
| India | 376 | 533,298 | 45,001,764 |
| Greenland | 371 | 21 | 11,971 |
| Brunei | 363 | 163 | 314,610 |
| Myanmar | 359 | 19,494 | 641,376 |
| Sao Tome and Principe | 351 | 80 | 6,635 |
| Zimbabwe | 350 | 5,727 | 265,927 |
| Singapore | 342 | 1,933 | 2,716,943 |
| Saint Pierre and Miquelon | 339 | 2 | 3,426 |
| Lesotho | 307 | 709 | 35,836 |
| Solomon Islands | 274 | 199 | 25,954 |
| Saudi Arabia | 264 | 9,646 | 841,469 |
| Qatar | 256 | 690 | 514,524 |
| United Arab Emirates | 248 | 2,349 | 1,067,030 |
| Egypt | 223 | 24,830 | 516,023 |
| Mauritania | 210 | 997 | 63,777 |
| Venezuela | 206 | 5,856 | 552,695 |
| Zambia | 203 | 4,069 | 349,298 |
| Afghanistan | 193 | 7,963 | 228,970 |
| Comoros | 191 | 160 | 9,109 |
| Kiribati | 182 | 24 | 5,085 |
| Cambodia | 182 | 3,056 | 138,954 |
| Macau | 174 | 121 | 3,514 |
| Bangladesh | 172 | 29,477 | 2,046,060 |
| Djibouti | 168 | 189 | 15,690 |
| Kyrgyzstan | 154 | 1,024 | 88,924 |
| Algeria | 153 | 6,881 | 271,997 |
| Syria | 142 | 3,163 | 57,423 |
| Samoa | 139 | 31 | 16,780 |
| Gambia | 137 | 372 | 12,626 |
| Malawi | 131 | 2,686 | 89,089 |
| Pakistan | 129 | 30,656 | 1,580,631 |
| Gabon | 128 | 307 | 49,046 |
| Cook Islands | 117 | 2 | 7,174 |
| Senegal | 113 | 1,971 | 89,025 |
| Tonga | 112 | 12 | 16,888 |
| Equatorial Guinea | 109 | 183 | 17,130 |
| Sudan | 107 | 5,046 | 63,993 |
| Rwanda | 106 | 1,468 | 133,208 |
| Kenya | 105 | 5,689 | 344,092 |
| Timor-Leste | 102 | 138 | 23,460 |
| Laos | 89 | 671 | 218,898 |
| Tuvalu | 88 | 1 | 2,943 |
| China[lower-alpha 3] | 85 | 121,874 | 99,320,286 |
| Guinea-Bissau | 84 | 177 | 9,614 |
| Nauru | 78 | 1 | 5,393 |
| Somalia | 77 | 1,361 | 27,334 |
| Uganda | 76 | 3,632 | 171,876 |
| Haiti | 74 | 860 | 34,482 |
| Cameroon | 70 | 1,974 | 125,116 |
| Mozambique | 68 | 2,250 | 233,676 |
| Papua New Guinea | 66 | 670 | 46,864 |
| Republic of the Congo | 65 | 389 | 25,206 |
| Yemen | 64 | 2,159 | 11,945 |
| Ethiopia | 61 | 7,574 | 501,087 |
| Liberia | 55 | 294 | 7,930 |
| Angola | 54 | 1,936 | 106,002 |
| Madagascar | 48 | 1,426 | 68,386 |
| Ghana | 43 | 1,462 | 171,768 |
| Vanuatu | 42 | 14 | 12,019 |
| Nicaragua | 35 | 245 | 16,065 |
| Guinea | 33 | 468 | 38,569 |
| Mali | 32 | 743 | 33,161 |
| Togo | 32 | 290 | 39,526 |
| Ivory Coast | 29 | 835 | 88,354 |
| Uzbekistan | 29 | 1,016 | 174,575 |
| Eritrea | 27 | 103 | 10,189 |
| Bhutan | 26 | 21 | 62,697 |
| Central African Republic | 20 | 113 | 15,367 |
| Burkina Faso | 17 | 398 | 22,093 |
| Democratic Republic of the Congo | 14 | 1,468 | 99,226 |
| Sierra Leone | 14 | 125 | 7,766 |
| Nigeria | 14 | 3,155 | 267,163 |
| Tanzania | 12 | 846 | 43,087 |
| South Sudan | 12 | 138 | 18,595 |
| Tajikistan | 12 | 125 | 17,786 |
| Benin | 12 | 163 | 28,036 |
| Niger | 12 | 315 | 9,515 |
| Chad | 10 | 194 | 7,698 |
| Burundi | 1 | 15 | 54,368 |
| North Korea | 0 | 6 | 1 |
| Pitcairn Islands | — | — | 4 |
| Falkland Islands | — | — | 1,923 |
| Niue | — | — | 895 |
| Turkmenistan | — | 0 | 0 |
| Vatican City | — | 0 | 26 |
| Tokelau | — | 0 | 80 |
| Saint Helena, Ascension and Tristan da Cunha | — | — | 2,166 |
| |||
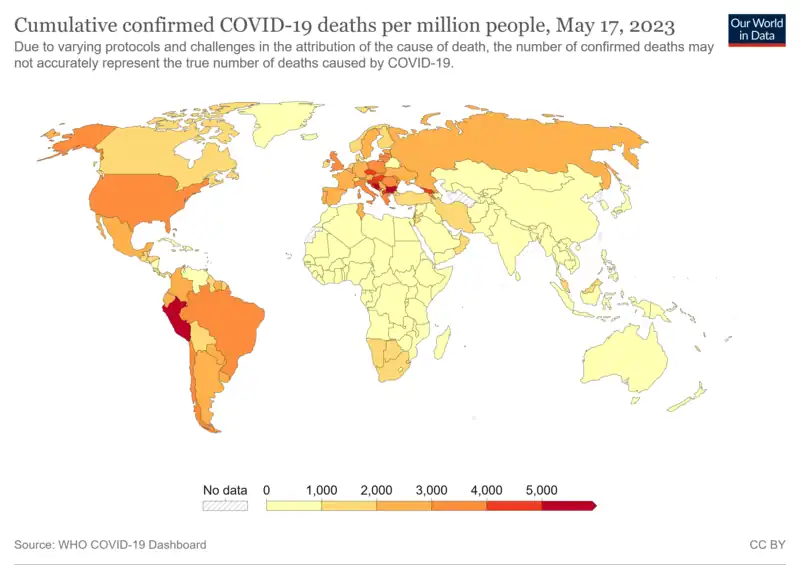
Map of death rates
Total confirmed COVID-19 deaths per million people by country:[12][note 3][note 4]
See also
- List of epidemics
- List of deaths due to COVID-19 – notable individual deaths
- COVID-19 vaccine
- Deployment of COVID-19 vaccines
Notes
- ↑ The table this note applies to is updated daily by a bot. For more info see Template:COVID-19 data/Cite.
- ↑ Our World in Data (OWID). See Coronavirus Source Data for OWID sourcing info. Excerpt: "Deaths and cases: our data source. Our World in Data relies on data from Johns Hopkins University. ... JHU updates its data multiple times each day. This data is sourced from governments, national and subnational agencies across the world — a full list of data sources for each country is published on Johns Hopkins GitHub site. It also makes its data publicly available there."
- 1 2 "CSSEGISandData/COVID-19". GitHub. 5 August 2022. COVID-19 Data Repository by the Center for Systems Science and Engineering (CSSE) at Johns Hopkins University. The CSV files are downloaded via the "Raw" links. The "Raw" link doesn't show up until you click the csv file link. This opens into a GitHub page with the data and the "Raw" link. See How to Use our Data for more info and links. See: Pandemic Data Initiative. See more sourcing history and info.
- ↑ Our World in Data (OWID) maps and graphs on cases and deaths. Click on the download tab to download the image. The table tab has a table of the exact data by country. The source tab says the data is from the COVID-19 Data Repository by the Center for Systems Science and Engineering (CSSE) at Johns Hopkins University. The image at the source is interactive and provides more detail. For example, for maps run your cursor over the color bar legend to see the countries that apply to that point in the legend. For graphs run your cursor over the graph for more info. See Coronavirus Source Data for more OWID sourcing info.
References
- ↑ "Demographic Trends of COVID-19 cases and deaths in the US reported to CDC". 2021-04-27.
- ↑ John Newton (12 August 2020). "Behind the headlines: Counting COVID-19 deaths". UK Health Security Agency. Retrieved 26 January 2020.
- ↑ Beaney, Thomas; Clarke, Jonathan M; Jain, Vageesh; Golestaneh, Amelia Kataria; Lyons, Gemma; Salman, David; Majeed, Azeem (2020). "Excess mortality: the gold standard in measuring the impact of COVID-19 worldwide?". Journal of the Royal Society of Medicine. 113 (9): 329–334. doi:10.1177/0141076820956802. ISSN 0141-0768. PMC 7488823. PMID 32910871.
Russia's case definition for a COVID-19 death, for example, relies solely on results from autopsy, unlike most European countries.6 Death must have been due directly to COVID-19, so it is not counted if a patient was found to have COVID-19 but it did not cause their death.6,7 This will lead to significant underreporting, especially as Russia has one of the highest numbers of COVID-19 cases worldwide and yet has a case fatality rate of only 1.7% as of 31 July 2020.3 Spain's definition requires a positive polymerase chain reaction or antibody test for COVID-19, with only hospital deaths included in the death count despite a significant number of deaths from COVID-19 in the community and care homes.8,9 Belgium, by contrast, has one of the broadest definitions for a COVID-19 death, including all suspected cases. Care home deaths in Belgium account for around half of all excess deaths, but only 26% of care home deaths were confirmed (rather than suspected) COVID-19,10 leading to possible overcounting relative to other countries.11
- ↑ Verity, Robert (March 30, 2020). "Estimates of the severity of coronavirus disease 2019: a model-based analysis". The Lancet. Infectious Diseases. 20 (6): 669–677. doi:10.1016/S1473-3099(20)30243-7. PMC 7158570. PMID 32240634.
- ↑ Aravindan, John Geddie (18 September 2020). "Why is Singapore's COVID-19 death rate the world's lowest". Reuters.
- ↑ Beaney, Thomas; Clarke, Jonathan M; Jain, Vageesh; Golestaneh, Amelia Kataria; Lyons, Gemma; Salman, David; Majeed, Azeem (2020). "Excess mortality: the gold standard in measuring the impact of COVID-19 worldwide?". Journal of the Royal Society of Medicine. 113 (9): 329–334. doi:10.1177/0141076820956802. ISSN 0141-0768. PMC 7488823. PMID 32910871.
Under the assumption that the incidence of other diseases remains steady over time, then excess deaths can be viewed as those caused both directly and indirectly by COVID-19 and gives a summary measure of the 'whole system' impact. ... Despite this, when seeking to understand the full impact of deaths due to COVID-19 and explain why excess deaths vary, there is a need to distinguish the component parts – of direct COVID-19 and indirect, non-COVID-19 deaths.
- ↑ Agence France-Presse (December 28, 2020). "Russia admits to world's third-worst Covid-19 death toll". The Guardian.
- 1 2 "COVID-19 Data Explorer". Our World in Data.
- ↑ "CBS: afgelopen jaar ruim 20.000 coronadoden". nos.nl (in Dutch). 7 April 2021.
- ↑ Rigby, Jennifer (2022-05-05). "Almost three times as many died as a result of COVID than officially reported - WHO". Reuters. Retrieved 2022-05-05.
- ↑ Ritchie, Hannah; Mathieu, Edouard; Rodés-Guirao, Lucas; Appel, Cameron; Giattino, Charlie; Ortiz-Ospina, Esteban; Hasell, Joe; Macdonald, Bobbie; Beltekian, Diana; Dattani, Saloni; Roser, Max (2020–2022). "Coronavirus Pandemic (COVID-19)". Our World in Data. Retrieved 2023-12-03.
- ↑ World map of cumulative confirmed COVID-19 deaths per million people. From Our World in Data.