| |||||||||||||||||||||||||||||||||||||||||||||||||||||||||||||
All 32 seats to Babergh District Council 17 seats needed for a majority | |||||||||||||||||||||||||||||||||||||||||||||||||||||||||||||
|---|---|---|---|---|---|---|---|---|---|---|---|---|---|---|---|---|---|---|---|---|---|---|---|---|---|---|---|---|---|---|---|---|---|---|---|---|---|---|---|---|---|---|---|---|---|---|---|---|---|---|---|---|---|---|---|---|---|---|---|---|---|
| |||||||||||||||||||||||||||||||||||||||||||||||||||||||||||||
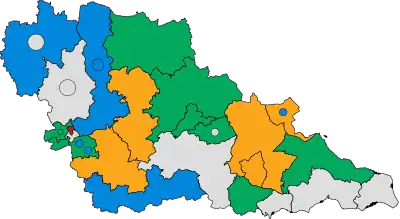 Winner of each seat at the 2023 Babergh District Council election | |||||||||||||||||||||||||||||||||||||||||||||||||||||||||||||
| |||||||||||||||||||||||||||||||||||||||||||||||||||||||||||||
The 2023 Babergh District Council election was held on 4 May 2023 to elect members of Babergh District Council in Suffolk, England.[1] This was on the same day as other local elections.
Summary
Election result
The council remained under no overall control, with the Greens emerging as the largest party.[2]
All parties, excluding the Conservatives, stood increased numbers of candidates since the 2019 election. The number of Labour and Liberal Democrat candidates doubled and the Green Party stood a full-slate for the first time at a Babergh District Council election. In contrast to the other parties, the number of Conservative candidates substantially declined, with several former councillors opting to stand as Independents.
| 2023 Babergh District Council election | ||||||||||
|---|---|---|---|---|---|---|---|---|---|---|
| Party | Candidates | Seats | Gains | Losses | Net gain/loss | Seats % | Votes % | Votes | +/− | |
| Green | 32 | 10 | 7 | 1 | 31.3 | 31.1 | 11,116 | +7.8 | ||
| Independent | 13 | 9 | 3 | 1 | 28.1 | 15.9 | 5,671 | –3.6 | ||
| Conservative | 21 | 7 | 1 | 9 | 21.9 | 24.1 | 8,610 | –10.7 | ||
| Liberal Democrats | 23 | 5 | 2 | 0 | 15.6 | 15.8 | 5,645 | +5.5 | ||
| Labour | 22 | 1 | 0 | 1 | 3.1 | 13.1 | 4,680 | +3.5 | ||
Ward results
The Statement of Persons Nominated, which details the candidates standing in each ward, was released by Babergh District Council following the close of nominations on 5 April 2023.[3]
Assington
| Party | Candidate | Votes | % | ±% | |
|---|---|---|---|---|---|
| Liberal Democrats | Lee Parker | 452 | 49.8 | N/A | |
| Conservative | Richard Sunderland | 341 | 37.6 | +4.5 | |
| Green | Amy Aylett | 115 | 12.7 | –4.7 | |
| Majority | 111 | 12.2 | N/A | ||
| Turnout | 917 | 41.0 | +1.6 | ||
| Registered electors | 2,237 | ||||
| Liberal Democrats gain from Independent | Swing | N/A | |||
Box Vale
| Party | Candidate | Votes | % | ±% | |
|---|---|---|---|---|---|
| Liberal Democrats | Bryn Hurren* | 684 | 64.0 | –16.1 | |
| Conservative | Fred Topham | 180 | 16.8 | –3.1 | |
| Green | Theresa Munson | 154 | 14.4 | N/A | |
| Labour | Rupert Perry | 51 | 4.8 | N/A | |
| Majority | 504 | 47.2 | –13.9 | ||
| Turnout | 1,071 | 46.3 | –1.5 | ||
| Registered electors | 2,313 | ||||
| Liberal Democrats hold | Swing | ||||
Brantham
| Party | Candidate | Votes | % | ±% | |
|---|---|---|---|---|---|
| Independent | Alastair McCraw* | 560 | 77.7 | –8.2 | |
| Green | Miriam Burns | 101 | 14.0 | +7.0 | |
| Labour | Steven Hunter | 60 | 8.3 | N/A | |
| Majority | 459 | 63.7 | –15.1 | ||
| Turnout | 721 | 33.9 | –7.0 | ||
| Registered electors | 2,127 | ||||
| Independent hold | Swing | ||||
Brett Vale
| Party | Candidate | Votes | % | ±% | |
|---|---|---|---|---|---|
| Independent | John Ward* | 457 | 39.7 | N/A | |
| Conservative | Shaun Davis | 352 | 30.6 | –16.2 | |
| Green | Peter Lynn | 158 | 13.7 | –6.2 | |
| Labour | Lindsay Francis | 102 | 8.9 | N/A | |
| Liberal Democrats | Benjamin Herbig | 81 | 7.0 | N/A | |
| Majority | 105 | 9.1 | N/A | ||
| Turnout | 1,151 | 43.7 | +2.9 | ||
| Registered electors | 2,636 | ||||
| Independent gain from Conservative | Swing | N/A | |||
Bures St Mary & Nayland
| Party | Candidate | Votes | % | ±% | |
|---|---|---|---|---|---|
| Conservative | Isabelle Reece | 369 | 39.8 | –13.4 | |
| Green | Patrick McKenna | 319 | 34.4 | –12.4 | |
| Liberal Democrats | Rain Welham-Cobb | 165 | 17.8 | N/A | |
| Labour | Julian Freeman | 73 | 7.9 | N/A | |
| Majority | 50 | 5.4 | –1.0 | ||
| Turnout | 932 | 41.6 | +7.4 | ||
| Registered electors | 2,242 | ||||
| Conservative hold | Swing | ||||
Capel St Mary
| Party | Candidate | Votes | % | ±% | |
|---|---|---|---|---|---|
| Liberal Democrats | John Whyman | 635 | 79.0 | –0.1 | |
| Green | Andrew Iredale Jaswal | 169 | 21.0 | N/A | |
| Majority | 466 | 58.0 | –0.2 | ||
| Turnout | 821 | 31.4 | –6.2 | ||
| Registered electors | 2,616 | ||||
| Liberal Democrats hold | Swing | N/A | |||
Chadacre
| Party | Candidate | Votes | % | ±% | |
|---|---|---|---|---|---|
| Conservative | Michael Holt* | 748 | 46.5 | –5.6 | |
| Independent | Stephen Plumb* | 712 | 44.3 | –21.3 | |
| Green | Ralph Carpenter | 541 | 33.6 | +8.8 | |
| Green | Polly Rodger-Brown | 314 | 19.5 | –2.1 | |
| Labour | Matthew Marshall | 278 | 17.3 | N/A | |
| Liberal Democrats | Cheryl Schmidt | 203 | 12.6 | N/A | |
| Turnout | 1,609 | 33.4 | +2.1 | ||
| Registered electors | 4,824 | ||||
| Conservative hold | |||||
| Independent hold | |||||
Copdock & Washbrook
| Party | Candidate | Votes | % | ±% | |
|---|---|---|---|---|---|
| Liberal Democrats | David Busby* | 591 | 56.4 | –5.0 | |
| Conservative | Christopher Hudson | 309 | 29.5 | –9.1 | |
| Green | Karen Marshall | 147 | 14.0 | N/A | |
| Majority | 282 | 26.9 | +4.1 | ||
| Turnout | 1,061 | 39.8 | ±0.0 | ||
| Registered electors | 2,663 | ||||
| Liberal Democrats hold | Swing | ||||
East Bergholt
| Party | Candidate | Votes | % | ±% | |
|---|---|---|---|---|---|
| Green | Sallie Davies | 546 | 52.7 | +27.0 | |
| Independent | John Hinton* | 253 | 24.4 | –20.0 | |
| Conservative | Stephen Williams | 141 | 13.6 | –16.4 | |
| Labour | Adrian James | 74 | 7.1 | N/A | |
| Liberal Democrats | Lauren De Banks | 22 | 2.1 | N/A | |
| Majority | 293 | 28.3 | N/A | ||
| Turnout | 1,044 | 46.5 | +5.6 | ||
| Registered electors | 2,243 | ||||
| Green gain from Independent | Swing | ||||
Ganges
| Party | Candidate | Votes | % | ±% | |
|---|---|---|---|---|---|
| Independent | Derek Davis* | 310 | 45.9 | –25.0 | |
| Conservative | Shane Rolin | 190 | 28.1 | +14.1 | |
| Green | Shazz Kennedy | 67 | 9.9 | +1.7 | |
| Labour | Simon Whitney | 63 | 9.3 | N/A | |
| Liberal Democrats | Paul Woodcraft | 45 | 6.7 | –0.1 | |
| Majority | 120 | 17.8 | –39.1 | ||
| Turnout | 676 | 34.1 | –7.9 | ||
| Registered electors | 1,982 | ||||
| Independent hold | Swing | ||||
Great Cornard
| Party | Candidate | Votes | % | ±% | |
|---|---|---|---|---|---|
| Green | Ruth Hendry | 694 | 35.4 | +14.6 | |
| Conservative | Mark Newman* | 660 | 33.7 | –4.5 | |
| Conservative | Peter Beer* | 658 | 33.6 | –5.7 | |
| Conservative | Judith Wilson | 627 | 32.0 | –3.8 | |
| Labour | Emma Bishton | 545 | 27.8 | –3.1 | |
| Labour | Kevin Graham | 542 | 27.6 | –0.6 | |
| Labour | Tom Keane | 450 | 22.9 | –3.0 | |
| Green | Melanie Boyce | 438 | 22.3 | +5.0 | |
| Green | Heather James | 396 | 20.2 | +4.0 | |
| Liberal Democrats | Marjorie Bark | 387 | 19.7 | +5.5 | |
| Turnout | 1,961 | 27.4 | +2.0 | ||
| Registered electors | 7,152 | ||||
| Green gain from Conservative | |||||
| Conservative hold | |||||
| Conservative hold | |||||
Hadleigh North
| Party | Candidate | Votes | % | ±% | |
|---|---|---|---|---|---|
| Green | Simon Dowling | 230 | 33.8 | +13.8 | |
| Conservative | Sian Dawson* | 199 | 29.3 | –6.7 | |
| Independent | Gordon McLeod | 101 | 14.9 | N/A | |
| Liberal Democrats | David Butcher | 80 | 11.8 | –10.5 | |
| Labour | Andy Kennedy | 70 | 10.3 | –11.5 | |
| Majority | 31 | 4.5 | N/A | ||
| Turnout | 686 | 30.3 | –2.2 | ||
| Registered electors | 2,266 | ||||
| Green gain from Conservative | Swing | ||||
Hadleigh South
| Party | Candidate | Votes | % | ±% | |
|---|---|---|---|---|---|
| Green | Jane Carruthers | 539 | 40.4 | +16.2 | |
| Independent | Kathryn Grandon* | 498 | 37.3 | –17.5 | |
| Green | Alex Parvu | 483 | 36.2 | +20.1 | |
| Conservative | Alan Ferguson | 418 | 31.3 | +2.6 | |
| Liberal Democrats | Duncan Read | 250 | 18.7 | N/A | |
| Labour | Mark Heath | 171 | 12.8 | –8.8 | |
| Turnout | 1,334 | 30.1 | –3.9 | ||
| Registered electors | 4,435 | ||||
| Green gain from Conservative | |||||
| Independent hold | |||||
Lavenham
| Party | Candidate | Votes | % | ±% | |
|---|---|---|---|---|---|
| Conservative | Margaret Maybury* | 966 | 52.7 | +6.8 | |
| Conservative | Paul Clover | 844 | 46.1 | +7.6 | |
| Independent | Clive Arthey* | 376 | 20.5 | –22.9 | |
| Liberal Democrats | Nigel Adam | 363 | 19.8 | N/A | |
| Green | Shaun Moffat | 355 | 19.4 | –14.0 | |
| Green | Steve Nuttall | 256 | 14.0 | N/A | |
| Labour | Andrew Worpole | 242 | 13.2 | N/A | |
| Turnout | 1,832 | 40.7 | +1.6 | ||
| Registered electors | 4,499 | ||||
| Conservative hold | |||||
| Conservative gain from Independent | |||||
Long Melford
| Party | Candidate | Votes | % | ±% | |
|---|---|---|---|---|---|
| Independent | John Nunn* | 1,069 | 65.2 | –11.2 | |
| Independent | Liz Malvisi* | 571 | 34.8 | N/A | |
| Conservative | Melanie Barrett | 399 | 23.4 | –13.1 | |
| Green | Fae Gilfillan | 279 | 17.0 | –5.9 | |
| Labour | Michael Fitzmaurice | 228 | 13.9 | N/A | |
| Green | Michael Chapman | 201 | 12.3 | ±0.0 | |
| Liberal Democrats | Alan Scott | 124 | 7.6 | N/A | |
| Turnout | 1,639 | 32.8 | –3.6 | ||
| Registered electors | 4,993 | ||||
| Independent hold | |||||
| Independent gain from Conservative | |||||
North West Cosford
| Party | Candidate | Votes | % | ±% | |
|---|---|---|---|---|---|
| Green | Deborah Saw | 630 | 82.9 | +12.3 | |
| Liberal Democrats | Mark Whyman | 130 | 17.1 | N/A | |
| Majority | 500 | 65.8 | +24.6 | ||
| Turnout | 804 | 36.8 | –8.8 | ||
| Registered electors | 2,187 | ||||
| Green hold | Swing | N/A | |||
Orwell
| Party | Candidate | Votes | % | ±% | |
|---|---|---|---|---|---|
| Green | Daniel Potter | 509 | 63.4 | –9.0 | |
| Liberal Democrats | Chris Janes | 191 | 23.8 | N/A | |
| Labour | Keith Wade | 103 | 12.8 | N/A | |
| Majority | 318 | 39.6 | –6.1 | ||
| Turnout | 824 | 38.7 | –6.1 | ||
| Registered electors | 2,129 | ||||
| Green hold | Swing | N/A | |||
South East Cosford
| Party | Candidate | Votes | % | ±% | |
|---|---|---|---|---|---|
| Green | Leigh Jamieson* | 811 | 88.9 | ||
| Liberal Democrats | Rebecca Simpson | 101 | 11.1 | +11.1 | |
| Majority | |||||
| Turnout | |||||
| Registered electors | |||||
| Green hold | Swing | ||||
Sproughton & Pinewood
| Party | Candidate | Votes | % | ±% | |
|---|---|---|---|---|---|
| Liberal Democrats | Helen Davies | 496 | 41.3 | N/A | |
| Conservative | Brian Riley | 474 | 39.4 | +2.6 | |
| Green | Mary Cook | 327 | 27.2 | –4.4 | |
| Labour | Mary Manuel | 237 | 19.7 | –11.9 | |
| Labour | Graham Manuel | 223 | 18.6 | N/A | |
| Green | John Lyall | 176 | 14.6 | N/A | |
| Turnout | 1,202 | 26.6 | +2.5 | ||
| Registered electors | 4,511 | ||||
| Liberal Democrats gain from Green | |||||
| Conservative hold | |||||
Stour
| Party | Candidate | Votes | % | ±% | |
|---|---|---|---|---|---|
| Independent | Mary McLaren* | 448 | 46.0 | N/A | |
| Green | Carrie Wheeler | 216 | 22.2 | +5.0 | |
| Liberal Democrats | James Gilchrist | 194 | 19.9 | –4.1 | |
| Labour | Tracy De Bernhardt Wood | 116 | 11.9 | N/A | |
| Majority | 232 | 23.8 | N/A | ||
| Turnout | 980 | 40.4 | –0.1 | ||
| Registered electors | 2,428 | ||||
| Independent gain from Conservative | Swing | N/A | |||
Sudbury North East
| Party | Candidate | Votes | % | ±% | |
|---|---|---|---|---|---|
| Labour Co-op | Alison Owen* | 176 | 37.7 | +1.3 | |
| Independent | Jan Osborne | 129 | 27.6 | N/A | |
| Conservative | Simon Barrett | 79 | 16.9 | –9.2 | |
| Green | Julie Fowles-Smith | 48 | 10.3 | –1.8 | |
| Liberal Democrats | Gareth Evans | 35 | 7.5 | N/A | |
| Majority | 47 | 10.1 | –0.2 | ||
| Turnout | 472 | 23.4 | –2.1 | ||
| Registered electors | 2,013 | ||||
| Labour Co-op hold | Swing | N/A | |||
Sudbury North West
| Party | Candidate | Votes | % | ±% | |
|---|---|---|---|---|---|
| Green | Jessie Carter | 800 | 55.7 | +38.1 | |
| Green | Tim Regester | 537 | 37.4 | +23.9 | |
| Conservative | Nicholas Younger | 348 | 24.3 | –9.1 | |
| Liberal Democrats | Nigel Bennett | 312 | 21.7 | –3.0 | |
| Labour | Adrian Stohr | 272 | 19.0 | –11.3 | |
| Labour | Matthew Olyver | 265 | 18.5 | –4.7 | |
| Turnout | 1,435 | 34.6 | +3.8 | ||
| Registered electors | 4,142 | ||||
| Green gain from Conservative | |||||
| Green gain from Labour | |||||
Sudbury South East
| Party | Candidate | Votes | % | ±% | |
|---|---|---|---|---|---|
| Independent | Adrian Osborne* | 187 | 28.3 | N/A | |
| Labour Co-op | David Finnigan | 172 | 26.0 | –8.1 | |
| Green | Debo Adams | 136 | 20.6 | +7.8 | |
| Conservative | Portia Berry-Kilby | 117 | 17.7 | –24.5 | |
| Liberal Democrats | Martin Bark | 49 | 7.4 | –3.5 | |
| Majority | 15 | 2.3 | N/A | ||
| Turnout | 662 | 34.6 | +3.8 | ||
| Registered electors | 1,911 | ||||
| Independent gain from Conservative | Swing | N/A | |||
Sudbury South West
| Party | Candidate | Votes | % | ±% | |
|---|---|---|---|---|---|
| Green | Laura Smith | 414 | 50.1 | +38.4 | |
| Conservative | Jacqueline Rawlinson | 191 | 23.1 | –12.5 | |
| Labour | Luke Cresswell | 167 | 20.2 | –7.7 | |
| Liberal Democrats | Andrew Welsh | 55 | 6.7 | –6.8 | |
| Majority | 223 | 27.0 | N/A | ||
| Turnout | 841 | 38.0 | +3.2 | ||
| Registered electors | 2,215 | ||||
| Green gain from Conservative | Swing | ||||
References
- ↑ "NOTICE OF ELECTION" (PDF). Babergh District Council. Retrieved 6 April 2023.
- ↑ "Babergh election result". BBC News. Retrieved 8 May 2023.
- ↑ "Statement of Persons Nominated" (PDF). Babergh District Council. Retrieved 6 April 2023.
External links
| Suffolk County Council | |
|---|---|
| Babergh District Council | |
| East Suffolk District Council | |
| Ipswich Borough Council | |
| Mid Suffolk District Council | |
| West Suffolk District Council | |
| East Suffolk County Council |
|
| Forest Heath District Council | |
| St Edmundsbury Borough Council | |
| Suffolk Coastal District Council | |
| Waveney District Council | |
| West Suffolk County Council |
|
| |