The 2022 Cambridge City Council election took place on 5 May 2022 to elect members of Cambridge City Council.[1] This is on the same day as other local elections.[2]
| |||||||||||||||||||||
16 out of 42 council seats up for election 22 seats needed for a majority | |||||||||||||||||||||
|---|---|---|---|---|---|---|---|---|---|---|---|---|---|---|---|---|---|---|---|---|---|
| |||||||||||||||||||||
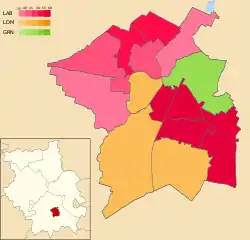 Map showing the strongest candidate by ward | |||||||||||||||||||||
Result summary
| 2022 Cambridge City Council election | ||||||||||
|---|---|---|---|---|---|---|---|---|---|---|
| Party | This election | Full council | This election | |||||||
| Seats | Net | Seats % | Other | Total | Total % | Votes | Votes % | +/− | ||
| Labour | 12 | 75.0 | 17 | 29 | 69.0 | 17,779 | 44.5 | +3.8 | ||
| Liberal Democrats | 3 | 18.8 | 6 | 9 | 21.4 | 10,801 | 27.1 | +1.3 | ||
| Green | 1 | 6.3 | 2 | 3 | 7.1 | 7,027 | 17.6 | –2.1 | ||
| Independent | 0 | 0.0 | 1 | 1 | 2.4 | 361 | 0.9 | –1.3 | ||
| Conservative | 0 | 0.0 | 0 | 0 | 0.0 | 3,940 | 9.9 | –1.7 | ||
Ward results
Abbey
| Party | Candidate | Votes | % | ±% | |
|---|---|---|---|---|---|
| Green | Matt Howard | 1,254 | 48.0 | +6.5 | |
| Labour | Amanda Hawkes | 974 | 37.3 | –1.1 | |
| Conservative | David Smith | 201 | 7.7 | –2.8 | |
| Liberal Democrats | Rosemary Ansell | 184 | 7.0 | –2.5 | |
| Majority | 280 | 10.7 | |||
| Turnout | 2,613 | ||||
| Green gain from Labour | Swing | ||||
Arbury
| Party | Candidate | Votes | % | ±% | |
|---|---|---|---|---|---|
| Labour | Iva Divkovic | 1,176 | 53.4 | +6.1 | |
| Labour | Patrick Sheil | 1,145 | 52.0 | +9.0 | |
| Liberal Democrats | Fionna Tod | 444 | 20.2 | +1.4 | |
| Liberal Democrats | Tim Ward | 423 | 19.2 | -4.3 | |
| Green | Stephen Lawrence | 366 | 16.6 | +2.0 | |
| Conservative | Robert Boorman | 317 | 14.4 | -0.1 | |
| Green | Peter Pope | 292 | 13.3 | -6.7 | |
| Conservative | Timothy Haire | 242 | 11.0 | -2.8 | |
| Turnout | |||||
| Labour hold | Swing | ||||
| Labour hold | Swing | ||||
Castle
| Party | Candidate | Votes | % | ±% | |
|---|---|---|---|---|---|
| Labour | Simon Smith | 886 | 41.8 | +4.5 | |
| Liberal Democrats | Caroline Stoddart | 751 | 35.5 | +1.5 | |
| Green | James Murray-White | 370 | 17.5 | –1.7 | |
| Conservative | James Appiah | 111 | 5.2 | –4.4 | |
| Majority | 135 | 6.3 | |||
| Turnout | 2,118 | ||||
| Labour hold | Swing | ||||
Cherry Hinton
| Party | Candidate | Votes | % | ±% | |
|---|---|---|---|---|---|
| Labour | Russ McPherson | 1,345 | 58.3 | +7.0 | |
| Conservative | Eric Barrett-Payton | 391 | 16.9 | –3.6 | |
| Green | Richard Potter | 290 | 12.6 | –0.9 | |
| Liberal Democrats | Peter McLaughlin | 283 | 12.3 | –2.4 | |
| Majority | 954 | 41.4 | |||
| Turnout | 2,309 | ||||
| Labour hold | Swing | ||||
Coleridge
| Party | Candidate | Votes | % | ±% | |
|---|---|---|---|---|---|
| Labour | Anna Smith | 1,363 | 56.3 | +8.9 | |
| Green | Sarah Nicmanis | 415 | 17.2 | –7.1 | |
| Conservative | Robin Nelson | 338 | 14.0 | –0.1 | |
| Liberal Democrats | Sam Oliver | 236 | 9.8 | –4.3 | |
| Independent | Monica Hone | 67 | 2.8 | N/A | |
| Majority | 948 | 39.1 | |||
| Turnout | 2,419 | ||||
| Labour hold | Swing | ||||
East Chesterton
| Party | Candidate | Votes | % | ±% | |
|---|---|---|---|---|---|
| Labour | Baiju Varkey | 974 | 38.2 | –4.4 | |
| Liberal Democrats | Bob Illingworth | 947 | 37.1 | +8.5 | |
| Green | Elizabeth May | 388 | 15.2 | –2.9 | |
| Conservative | Frank Ribeiro | 243 | 9.5 | +0.4 | |
| Majority | 27 | +1.1 | |||
| Turnout | 2,552 | ||||
| Labour gain from Liberal Democrats | Swing | ||||
King's Hedges
| Party | Candidate | Votes | % | ±% | |
|---|---|---|---|---|---|
| Labour | Martin Smart | 968 | 50.6 | +4.8 | |
| Liberal Democrats | Rory Clark | 383 | 20.0 | +0.7 | |
| Green | Dan Kittmer | 314 | 16.4 | –0.3 | |
| Conservative | Mohammed Uddin | 248 | 13.0 | –5.1 | |
| Majority | 585 | 30.6 | |||
| Turnout | 1,913 | ||||
| Labour hold | Swing | ||||
Market
| Party | Candidate | Votes | % | ±% | |
|---|---|---|---|---|---|
| Liberal Democrats | Katie Porrer | 904 | 43.4 | +8.2 | |
| Labour | Hollie Wright | 680 | 32.6 | –1.8 | |
| Green | Nicola Elliott | 364 | 17.5 | –5.0 | |
| Conservative | Sam Hunt | 137 | 6.6 | –1.3 | |
| Majority | 224 | 10.8 | |||
| Turnout | 2,085 | ||||
| Liberal Democrats hold | Swing | ||||
Newnham
| Party | Candidate | Votes | % | ±% | |
|---|---|---|---|---|---|
| Labour | Cameron Holloway | 813 | 36.4 | +2.1 | |
| Liberal Democrats | Al Gadney | 738 | 33.0 | –2.4 | |
| Green | Jean Glasberg | 558 | 25.0 | +2.1 | |
| Conservative | Mo Pantall | 125 | 5.6 | –1.8 | |
| Majority | 75 | 3.4 | |||
| Turnout | 2,234 | ||||
| Labour gain from Liberal Democrats | Swing | ||||
Petersfield
| Party | Candidate | Votes | % | ±% | |
|---|---|---|---|---|---|
| Labour | Richard Robertson | 1,554 | 55.6 | +11.5 | |
| Liberal Democrats | Emmanuel Carraud | 598 | 21.4 | –4.0 | |
| Green | Edwin Wilkinson | 456 | 16.3 | –4.6 | |
| Conservative | Mohamed Hossain | 188 | 6.7 | –2.9 | |
| Majority | 956 | 34.2 | |||
| Turnout | 2,769 | ||||
| Labour hold | Swing | ||||
Queen Edith’s
| Party | Candidate | Votes | % | ±% | |
|---|---|---|---|---|---|
| Liberal Democrats | Daniel Lee | 1,202 | 42.0 | +18.6 | |
| Labour | Steve King | 881 | 30.8 | +16.7 | |
| Green | Jacqueline Whitmore | 396 | 13.8 | +3.5 | |
| Conservative | Geoffrey Owen | 382 | 13.4 | +2.2 | |
| Majority | 321 | 11.2 | |||
| Turnout | 2,861 | ||||
| Liberal Democrats hold | Swing | ||||
Romsey
| Party | Candidate | Votes | % | ±% | |
|---|---|---|---|---|---|
| Labour | Dinah Pounds | 1,548 | 58.1 | +7.0 | |
| Green | Suzie Webb | 486 | 18.2 | –2.7 | |
| Liberal Democrats | John Walmsley | 416 | 15.6 | –1.5 | |
| Conservative | Paul Roper | 215 | 8.1 | –2.8 | |
| Majority | 1,062 | 39.9 | |||
| Turnout | 2,665 | ||||
| Labour hold | Swing | ||||
Trumpington
| Party | Candidate | Votes | % | ±% | |
|---|---|---|---|---|---|
| Liberal Democrats | Olaf Hauk | 1,151 | 42.1 | +4.2 | |
| Labour | Carlos Toranzos | 853 | 31.2 | +3.6 | |
| Conservative | Shapour Meftah | 379 | 13.9 | –2.9 | |
| Green | Ceri Galloway | 352 | 12.9 | –4.8 | |
| Majority | 298 | 10.9 | |||
| Turnout | 2,735 | ||||
| Liberal Democrats hold | Swing | ||||
West Chesterton
| Party | Candidate | Votes | % | ±% | |
|---|---|---|---|---|---|
| Labour | Richard Swift | 1,390 | 44.8 | -0.4 | |
| Labour | Sam Carling | 1,229 | 39.6 | +2.7 | |
| Liberal Democrats | Jamie Dalzell | 1,171 | 37.7 | -1.2 | |
| Liberal Democrats | Shahida Rahman | 970 | 31.3 | -0.2 | |
| Green | Shayne Mitchell | 389 | 12.5 | -1.5 | |
| Green | Emma Garnett | 337 | 10.9 | -8.0 | |
| Independent | Jason Scott-Warren | 294 | 9.5 | N/A | |
| Conservative | Jean-Ann Bartlett | 232 | 7.5 | -2.4 | |
| Conservative | Michael Harford | 191 | 6.2 | -0.8 | |
| Turnout | |||||
| Labour gain from Liberal Democrats | Swing | ||||
| Labour hold | Swing | ||||
By-elections
Trumpington
| Party | Candidate | Votes | % | ±% | |
|---|---|---|---|---|---|
| Liberal Democrats | David Levien | 1,017 | 49.8 | +7.7 | |
| Labour | Rahima Ahammed | 472 | 23.1 | -8.1 | |
| Green | Ceri Galloway | 298 | 14.6 | +1.7 | |
| Conservative | Shapour Meftah | 256 | 12.5 | -1.4 | |
| Majority | 545 | 26.7 | |||
| Turnout | 2,049 | 27.3 | |||
| Liberal Democrats hold | |||||
References
- ↑ "Elections in 2022". Cambridge City Council. Retrieved 2022-05-01.
- ↑ "Elections 2022: Where will people be voting in Cambridgeshire?". BBC News. 2022-04-06. Retrieved 2022-05-01.
- ↑ "Result of City Council by-election in Trumpington ward". 18 August 2022. Retrieved 21 October 2022.
| Cambridgeshire County Council | |
|---|---|
| Peterborough City Council | |
| Cambridge City Council | |
| East Cambridgeshire District Council | |
| Fenland District Council | |
| Huntingdonshire District Council | |
| South Cambridgeshire District Council | |
| Isle of Ely County Council |
|
| Huntingdon & Peterborough County Council |
|
| Mayor of Cambridgeshire and Peterborough | |
| |
This article is issued from Wikipedia. The text is licensed under Creative Commons - Attribution - Sharealike. Additional terms may apply for the media files.