| ||||||||||||||||||||||||||||||||||||||||||||||||||||||
All 19 seats to Antrim Borough Council 10 seats needed for a majority | ||||||||||||||||||||||||||||||||||||||||||||||||||||||
|---|---|---|---|---|---|---|---|---|---|---|---|---|---|---|---|---|---|---|---|---|---|---|---|---|---|---|---|---|---|---|---|---|---|---|---|---|---|---|---|---|---|---|---|---|---|---|---|---|---|---|---|---|---|---|
| ||||||||||||||||||||||||||||||||||||||||||||||||||||||
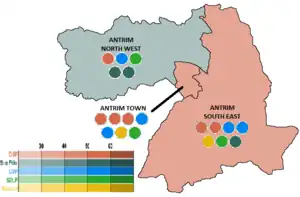 2005 Antrim Council Election Results, shaded by plurality of First Preference Votes. | ||||||||||||||||||||||||||||||||||||||||||||||||||||||


Elections to Antrim Borough Council were held on 5 May 2005 on the same day as the other Northern Irish local government elections. The election used three district electoral areas to elect a total of 19 councillors.
Election results
| Party | Seats | Gains | Losses | Net gain/loss | Seats % | Votes % | Votes | +/− | |
|---|---|---|---|---|---|---|---|---|---|
| DUP | 6 | 1 | 0 | 31.6 | 30.7 | 5,434 | |||
| Ulster Unionist | 5 | 0 | 2 | 26.3 | 23.8 | 4,203 | |||
| SDLP | 3 | 0 | 2 | 15.8 | 20.5 | 3,633 | |||
| Sinn Féin | 3 | 1 | 0 | 15.8 | 14.8 | 2,620 | |||
| Alliance | 2 | 2 | 0 | 10.5 | 6.9 | 1,214 | |||
| Independent | 0 | 0 | 0 | 0.0 | 2.6 | 468 | |||
| PUP | 0 | 0 | 0 | 0.0 | 0.6 | 110 | |||
Note: "Votes" are the first preference votes.
Districts summary
| Ward | % |
Cllrs |
% |
Cllrs |
% |
Cllrs |
% |
Cllrs |
% |
Cllrs |
% |
Cllrs |
Total Cllrs |
|---|---|---|---|---|---|---|---|---|---|---|---|---|---|
| DUP | UUP | SDLP | Sinn Féin | Alliance | Others | ||||||||
| Antrim North West | 24.9 | 1 | 14.1 | 1 | 27.4 | 1 | 28.7 | 2 | 0.0 | 0 | 4.9 | 0 | 5 |
| Antrim South East | 34.6 | 2 | 27.4 | 2 | 20.0 | 1 | 9.0 | 1 | 8.3 | 1 | 0.7 | 0 | 7 |
| Antrim Town | 31.2 | 3 | 28.4 | 2 | 14.6 | 1 | 9.0 | 0 | 11.7 | 1 | 5.1 | 0 | 7 |
| Total | 30.7 | 6 | 23.8 | 5 | 20.5 | 3 | 14.8 | 3 | 6.9 | 2 | 3.3 | 0 | 19 |
Districts results
Antrim North West
2001: 2 x SDLP, 1 x Sinn Féin, 1 x DUP, 1 x UUP
2005: 2 x Sinn Féin, 1 x SDLP, 1 x DUP, 1 x UUP
2001-2005 Change: Sinn Féin gain from SDLP
| Party | Candidate | FPv% | Count | ||||
|---|---|---|---|---|---|---|---|
| 1 | 2 | 3 | 4 | ||||
| SDLP | Robert Loughran* | 19.37% | 1,008 | ||||
| Sinn Féin | Henry Cushinan | 16.81% | 875 | ||||
| Ulster Unionist | Stephen Nicholl* | 14.10% | 734 | 821 | 876 | ||
| Sinn Féin | Anthony Brady | 11.93% | 621 | 621 | 800 | 925.25 | |
| DUP | Trevor Clarke | 13.37% | 696 | 791 | 795 | 801.25 | |
| DUP | Wilson Clyde* | 11.49% | 598 | 639 | 645 | 653.25 | |
| SDLP | Donovan McClelland* | 8.03% | 418 | 430 | |||
| Independent | Brian Johnston | 4.90% | 255 | ||||
| Electorate: 8,345 Valid: 5,205 (62.37%) Spoilt: 110 Quota: 868 Turnout: 5,315 (63.69%) | |||||||
Antrim South East
2001: 3 x UUP, 2 x DUP, 1 x SDLP, 1 x Sinn Féin
2005: 2 x DUP, 2 x UUP, 1 x SDLP, 1 x Sinn Féin, 1 x Alliance
2001-2005 Change: Alliance gain from UUP
| Party | Candidate | FPv% | Count | ||||||||
|---|---|---|---|---|---|---|---|---|---|---|---|
| 1 | 2 | 3 | 4 | 5 | 6 | 7 | 8 | ||||
| SDLP | Thomas Burns* | 19.96% | 1,435 | ||||||||
| DUP | Samuel Dunlop* | 14.83% | 1,066 | ||||||||
| Ulster Unionist | Danny Kinahan | 12.57% | 904 | ||||||||
| Ulster Unionist | Mervyn Rea* | 11.03% | 793 | 833.4 | 833.4 | 841.2 | 842.2 | 1,048.2 | |||
| DUP | Mel Lucas | 8.39% | 603 | 608.6 | 608.6 | 630.2 | 630.2 | 642.75 | 671.85 | 948.4 | |
| Sinn Féin | Anne-Marie Logue | 6.29% | 452 | 656.8 | 674.4 | 674.85 | 893.45 | 893.45 | 894.42 | 895.97 | |
| Alliance | Alan Lawther | 8.32% | 598 | 789.2 | 805.4 | 806.6 | 822.8 | 835.3 | 877.98 | 890.7 | |
| DUP | Roy Thompson* | 7.13% | 513 | 516.2 | 517.2 | 529.5 | 529.5 | 549.8 | 584.72 | 741.04 | |
| DUP | William Harkness* | 4.30% | 309 | 320.2 | 320.2 | 433.6 | 433.6 | 450.85 | 491.59 | ||
| Ulster Unionist | Roderick Swann | 3.77% | 271 | 275.4 | 275.4 | 277.35 | 277.35 | ||||
| Sinn Féin | Bernard McCrory | 2.74% | 197 | 248.2 | 256.4 | 256.4 | |||||
| Independent | Patricia Murray | 0.68% | 49 | 62.2 | |||||||
| Electorate: 12,005 Valid: 7,190 (59.89%) Spoilt: 104 Quota: 899 Turnout: 7,294 (60.76%) | |||||||||||
Antrim Town
2001: 3 x UUP, 2 x DUP, 2 x SDLP
2005: 3 x DUP, 2 x UUP, 1 x SDLP, 1 x Alliance
2001-2005 Change: DUP and Alliance gain from UUP and SDLP
| Party | Candidate | FPv% | Count | |||||||
|---|---|---|---|---|---|---|---|---|---|---|
| 1 | 2 | 3 | 4 | 5 | 6 | 7 | ||||
| DUP | John Smyth* | 13.33% | 705 | |||||||
| Ulster Unionist | Adrian Cochrane-Watson* | 12.65% | 669 | |||||||
| SDLP | Oran Keenan* | 8.08% | 427 | 427.06 | 434.12 | 684.12 | ||||
| Alliance | David Ford | 11.65% | 616 | 616.66 | 626.72 | 680.72 | ||||
| Ulster Unionist | Andrew Ritchie | 8.00% | 423 | 425.52 | 485.12 | 489.12 | 490.47 | 791.47 | ||
| DUP | Brian Graham* | 8.80% | 465 | 484.86 | 537.28 | 538.28 | 538.58 | 579.36 | 658.41 | |
| DUP | Pam Lewis | 9.06% | 479 | 493.94 | 539.3 | 543.3 | 544.05 | 574.89 | 626.04 | |
| Sinn Féin | Gerard Magee | 8.98% | 475 | 475 | 490 | 518 | 534.65 | 539.1 | 539.1 | |
| Ulster Unionist | Paul Michael* | 7.02% | 371 | 372.8 | 439.1 | 441.1 | 444.1 | |||
| SDLP | Brian Duffin | 6.53% | 345 | 345.06 | 356.06 | |||||
| Independent | Darran Smyth | 2.57% | 136 | 136.9 | ||||||
| PUP | Ken Wilkinson | 2.08% | 110 | 110.66 | ||||||
| Ulster Unionist | James Sands | 0.72% | 38 | 38.48 | ||||||
| Independent | Aine Gribbon | 0.53% | 28 | 28 | ||||||
| Electorate: 10,792 Valid: 5,287 (48.99%) Spoilt: 123 Quota: 661 Turnout: 5,410 (50.13%) | ||||||||||
References
- 1 2 "Antrim Borough Council, 1993-2001". www.ark.ac.uk.
- 1 2 3 "Local Government Results 2005". EONI. Retrieved 8 July 2021.
| County council elections |
|
|---|---|
| Unitary authorities |
|
| District councils (Northern Ireland) | |
| Sui generis |
|
| Mayoral elections |
|
| |
This article is issued from Wikipedia. The text is licensed under Creative Commons - Attribution - Sharealike. Additional terms may apply for the media files.