| |||||||||||||||||||||||||
14 of the 44 seats in the Derby City Council 23 seats needed for a majority | |||||||||||||||||||||||||
|---|---|---|---|---|---|---|---|---|---|---|---|---|---|---|---|---|---|---|---|---|---|---|---|---|---|
| |||||||||||||||||||||||||
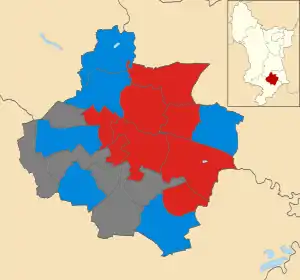 Map showing the results of the 1980 Derby City Council elections. | |||||||||||||||||||||||||
| |||||||||||||||||||||||||
The 1980 Derby City Council election took place on 1 May 1980 to elect members of Derby City Council in England.[3] This was on the same day as other local elections. 14 of the council's 44 seats were up for election. The Labour Party retained control of the council.
Overall results
| Party | Seats | Gains | Losses | Net gain/loss | Seats % | Votes % | Votes | +/− | |
|---|---|---|---|---|---|---|---|---|---|
| Labour | 8 | 0 | 0 | 57.1 | 51.7 | 20,611 | |||
| Conservative | 6 | 0 | 0 | 42.9 | 42.5 | 16,935 | |||
| Liberal | 0 | 0 | 0 | 0.0 | 5.5 | 2,194 | |||
| Ecology | 0 | 0 | 0 | 0.0 | 0.1 | 57 | |||
| United English National | 0 | 0 | 0 | 0.0 | 0.1 | 40 | |||
| Total | 14 | 39,837 | |||||||
Ward results
Abbey
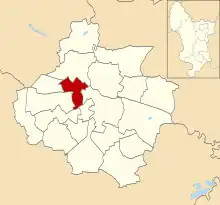
Location of Abbey ward
| Party | Candidate | Votes | % | |
|---|---|---|---|---|
| Labour | D. McNab | 1,574 | 64.9% | |
| Conservative | K. Hutchinson | 852 | 35.1% | |
| Turnout | 25.1% | |||
| Labour hold | ||||
Allestree
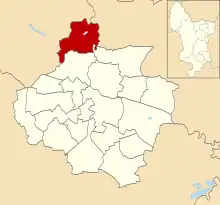
Location of Allestree ward
| Party | Candidate | Votes | % | |
|---|---|---|---|---|
| Conservative | B. Chadwick | 2,134 | 66.8% | |
| Labour | S. Davies | 575 | 18.0% | |
| Liberal | W. Webley | 484 | 15.2% | |
| Turnout | 39.3% | |||
| Conservative hold | ||||
Alvaston
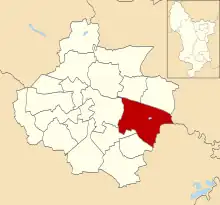
Location of Alvaston ward
| Party | Candidate | Votes | % | |
|---|---|---|---|---|
| Labour | G. Sweeting | 1,312 | 64.0% | |
| Conservative | J. Lissett | 739 | 36.0% | |
| Turnout | 30.8% | |||
| Labour hold | ||||
Babington
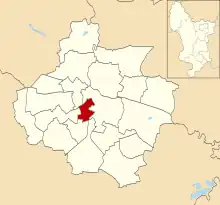
Location of Babington ward
| Party | Candidate | Votes | % | |
|---|---|---|---|---|
| Labour | S. Unwin | 1,856 | 71.9% | |
| Conservative | J. Keith | 725 | 28.1% | |
| Turnout | 27.4% | |||
| Labour hold | ||||
Blagreaves
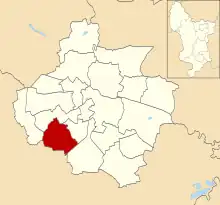
Location of Blagreaves ward
| Party | Candidate | Votes | % | |
|---|---|---|---|---|
| Conservative | F. Murphy | 1,481 | 50.2% | |
| Labour | P. McLaverty | 1,470 | 49.8% | |
| Turnout | 37.3% | |||
| Conservative hold | ||||
Boulton

Location of Boulton ward
| Party | Candidate | Votes | % | |
|---|---|---|---|---|
| Labour | I. Slater | 2,029 | 63.7% | |
| Conservative | D. Hazelwood | 1,157 | 36.3% | |
| Turnout | 39.4% | |||
| Labour hold | ||||
Breadsall
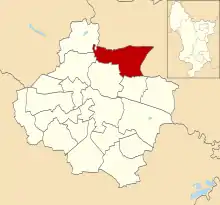
Location of Breadsall ward
| Party | Candidate | Votes | % | |
|---|---|---|---|---|
| Labour | M. Wawman | 1,865 | 69.5% | |
| Conservative | T. Hoogerwerf | 777 | 29.0% | |
| United English National | S. Gibson | 40 | 1.5% | |
| Turnout | 28.2% | |||
| Labour hold | ||||
Chaddesden
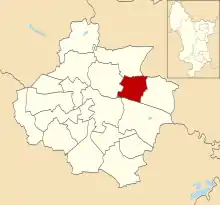
Location of Chaddesden ward
| Party | Candidate | Votes | % | |
|---|---|---|---|---|
| Labour | G. Summers | 1,826 | 57.9% | |
| Conservative | G. Andrews | 1,329 | 42.1% | |
| Turnout | 35.7% | |||
| Labour hold | ||||
Chellaston
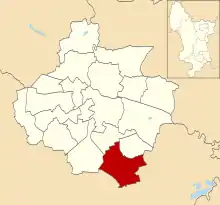
Location of Chellaston ward
| Party | Candidate | Votes | % | |
|---|---|---|---|---|
| Conservative | J. Blount | 1,513 | 51.3% | |
| Labour | M. Fuller | 1,437 | 48.7% | |
| Turnout | 40.4% | |||
| Conservative hold | ||||
Darley
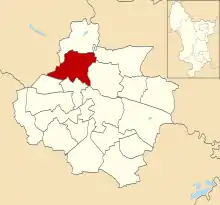
Location of Darley ward
| Party | Candidate | Votes | % | |
|---|---|---|---|---|
| Conservative | R. Longdon | 2,072 | 57.7% | |
| Labour | D. Parnham | 1,168 | 32.5% | |
| Liberal | M. Kennelly | 353 | 9.8% | |
| Turnout | 37.7% | |||
| Conservative hold | ||||
Derwent
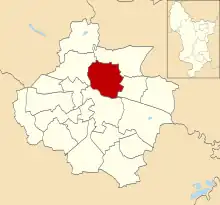
Location of Derwent ward
| Party | Candidate | Votes | % | |
|---|---|---|---|---|
| Labour | L. Topham | 1,495 | 61.3% | |
| Conservative | B. Daniels | 482 | 19.8% | |
| Liberal | S. Connolly | 463 | 19.0% | |
| Turnout | 30.7% | |||
| Labour hold | ||||
Kingsway
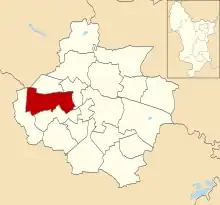
Location of Kingsway ward
| Party | Candidate | Votes | % | |
|---|---|---|---|---|
| Conservative | J. Bates | 1,523 | 52.1% | |
| Labour | E. Jones | 811 | 27.8% | |
| Liberal | A. Smith | 588 | 20.1% | |
| Turnout | 37.1% | |||
| Conservative hold | ||||
Litchurch
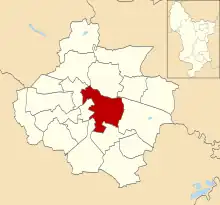
Location of Litchurch ward
| Party | Candidate | Votes | % | |
|---|---|---|---|---|
| Labour | M. Wood | 1,557 | 81.2% | |
| Conservative | A. Northover | 361 | 18.8% | |
| Turnout | 21.8% | |||
| Labour hold | ||||
Spondon
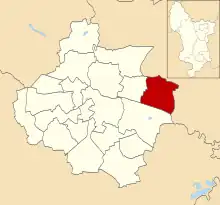
Location of Spondon ward
| Party | Candidate | Votes | % | |
|---|---|---|---|---|
| Conservative | D. Edgar | 1,790 | 47.2% | |
| Labour | J. Osborn | 1,636 | 43.2% | |
| Liberal | T. Dickenson | 306 | 8.1% | |
| Ecology | B. Sabine | 57 | 1.5% | |
| Turnout | 39.2% | |||
| Conservative hold | ||||
References
- ↑ "Council compositions by year". The Elections Centre.
- ↑ "Local Election Summaries 1980". The Elections Centre.
- ↑ Rallings, Colin; Thrasher, Michael. Local Elections Handbook 1980. Plymouth University, Plymouth, UK: The Elections Centre. p. 16.
- 1 2 3 4 5 6 7 8 9 10 11 12 13 14 "Derby City Council Election Results 1979-1995" (PDF). Elections Centre.
This article is issued from Wikipedia. The text is licensed under Creative Commons - Attribution - Sharealike. Additional terms may apply for the media files.