 | |||||||||||||||||||||||||||||||||||||
All 99 seats to Merseyside County Council 50 seats needed for a majority | |||||||||||||||||||||||||||||||||||||
|---|---|---|---|---|---|---|---|---|---|---|---|---|---|---|---|---|---|---|---|---|---|---|---|---|---|---|---|---|---|---|---|---|---|---|---|---|---|
| Turnout | 35.6% ( | ||||||||||||||||||||||||||||||||||||
| |||||||||||||||||||||||||||||||||||||
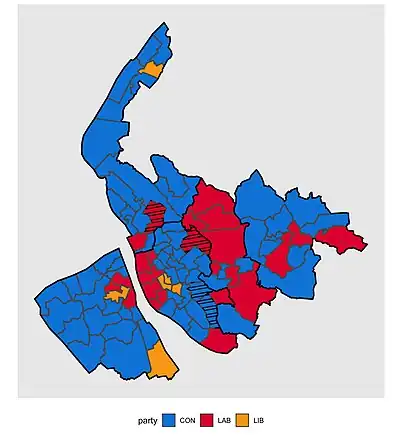 Map of Merseyside County Council showing wards won by party[2] | |||||||||||||||||||||||||||||||||||||
| |||||||||||||||||||||||||||||||||||||
The 1977 Merseyside County Council election took place on 5 May 1977 to elect members of Merseyside County Council in England.[1] This was on the same day as other local elections.
The Conservative Party gained overall control of the council from Labour.
Election results
Overall election result
Overall result compared with 1973.
| Merseyside County Council election, 1977 | |||||||||||||||
|---|---|---|---|---|---|---|---|---|---|---|---|---|---|---|---|
| Party | Candidates | Votes | |||||||||||||
| Stood | Elected | Gained | Unseated | Net | % of total | % | No. | Net % | |||||||
| Conservative | 99 | 67 | 41 | 0 | 67.7 | 55.1 | 224,376 | ||||||||
| Labour | 93 | 26 | 0 | 27 | 26.3 | 27.4 | 111,733 | ||||||||
| Liberal | 78 | 6 | 1 | 14 | 6.1 | 16.3 | 66,579 | ||||||||
| Communist | 19 | 0 | 0 | 0 | 0.0 | 0.6 | 2,425 | ||||||||
| Ind. Conservative | 1 | 0 | 0 | 0 | 0.0 | 0.2 | 765 | ||||||||
| Independent | 1 | 0 | 0 | 0 | 0.0 | 0.1 | 465 | ||||||||
| National Party | 3 | 0 | 0 | 0 | 0.0 | 0.1 | 392 | New | |||||||
| National Front | 3 | 0 | 0 | 0 | 0.0 | 0.1 | 228 | New | |||||||
| Labour/Liberal | 1 | 0 | 0 | 0 | 0.0 | 0.0 | 86 | New | |||||||
| Independent Liberal | 1 | 0 | 0 | 0 | 0.0 | 0.0 | 83 | N/A | |||||||
| Anti-corruption League | 1 | 0 | 0 | 0 | 0.0 | 0.0 | 60 | New | |||||||
| Liberal Union | 1 | 0 | 0 | 0 | 0.0 | 0.0 | 59 | New | |||||||
| Independent Labour | 1 | 0 | 0 | 0 | 0.0 | 0.0 | 45 | N/A | |||||||
| Residents | 0 | 0 | 0 | 1 | 0.0 | 0.0 | 0 | ||||||||
Results by borough
Knowsley borough
| Merseyside County Council election, 1977 (Knowsley) | |||||||||||||||
|---|---|---|---|---|---|---|---|---|---|---|---|---|---|---|---|
| Party | Candidates | Votes | |||||||||||||
| Stood | Elected | Gained | Unseated | Net | % of total | % | No. | Net % | |||||||
| Conservative | 11 | 4 | 3 | 0 | 36.4 | 48.5 | 18,095 | ||||||||
| Labour | 11 | 7 | 0 | 3 | 63.6 | 44.8 | 16,747 | ||||||||
| Liberal | 3 | 0 | 0 | 0 | 0.0 | 3.4 | 1,272 | ||||||||
| Ind. Conservative | 1 | 0 | 0 | 0 | 0.0 | 2.0 | 765 | N/A | |||||||
| Communist | 3 | 0 | 0 | 0 | 0.0 | 1.1 | 422 | ||||||||
| Independent Labour | 1 | 0 | 0 | 0 | 0.0 | 0.1 | 45 | N/A | |||||||
Turnout: 29.8% (![]() 1.7%)
1.7%)
Liverpool borough
| Merseyside County Council election, 1977 (Liverpool) | |||||||||||||||
|---|---|---|---|---|---|---|---|---|---|---|---|---|---|---|---|
| Party | Candidates | Votes | |||||||||||||
| Stood | Elected | Gained | Unseated | Net | % of total | % | No. | Net % | |||||||
| Conservative | 36 | 23 | 19 | 0 | 63.9 | 47.0 | 64,528 | ||||||||
| Labour | 36 | 10 | 0 | 8 | 27.8 | 28.2 | 38,754 | ||||||||
| Liberal | 34 | 3 | 0 | 11 | 8.3 | 23.5 | 32,314 | ||||||||
| Communist | 9 | 0 | 0 | 0 | 0.0 | 0.9 | 1,247 | ||||||||
| National Party | 1 | 0 | 0 | 0 | 0.0 | 0.1 | 162 | New | |||||||
| National Front | 2 | 0 | 0 | 0 | 0.0 | 0.1 | 95 | New | |||||||
| Labour/Liberal | 1 | 0 | 0 | 0 | 0.0 | 0.1 | 86 | New | |||||||
| Independent Liberal | 1 | 0 | 0 | 0 | 0.0 | 0.1 | 83 | N/A | |||||||
| Liberal Union | 1 | 0 | 0 | 0 | 0.0 | 0.0 | 59 | New | |||||||
Turnout: 33.9% (![]() 0.5%)
0.5%)
Sefton borough
| Merseyside County Council election, 1977 (Sefton) | |||||||||||||||
|---|---|---|---|---|---|---|---|---|---|---|---|---|---|---|---|
| Party | Candidates | Votes | |||||||||||||
| Stood | Elected | Gained | Unseated | Net | % of total | % | No. | Net % | |||||||
| Conservative | 19 | 15 | 4 | 0 | 78.9 | 63.7 | 47,794 | ||||||||
| Labour | 15 | 3 | 0 | 3 | 15.8 | 20.2 | 15,160 | ||||||||
| Liberal | 13 | 1 | 0 | 0 | 5.3 | 14.7 | 11,002 | ||||||||
| Communist | 4 | 0 | 0 | 0 | 0.0 | 0.7 | 512 | ||||||||
| Independent | 1 | 0 | 0 | 0 | 0.0 | 0.6 | 465 | ||||||||
| Anti-corruption League | 1 | 0 | 0 | 0 | 0.0 | 0.1 | 60 | New | |||||||
| Residents | 0 | 0 | 0 | 1 | 0.0 | 0.0 | 0 | ||||||||
Turnout: 34.0% (![]() 6.0%)
6.0%)
St Helens borough
| Merseyside County Council election, 1977 (St Helens) | |||||||||||||||
|---|---|---|---|---|---|---|---|---|---|---|---|---|---|---|---|
| Party | Candidates | Votes | |||||||||||||
| Stood | Elected | Gained | Unseated | Net | % of total | % | No. | Net % | |||||||
| Conservative | 11 | 8 | 6 | 0 | 72.7 | 58.0 | 29,725 | ||||||||
| Labour | 11 | 3 | 0 | 6 | 27.3 | 36.4 | 18,665 | ||||||||
| Liberal | 6 | 0 | 0 | 0 | 0.0 | 5.6 | 2,850 | ||||||||
Turnout: 37.3% (![]() 2.9)
2.9)
Wirral borough
| Merseyside County Council election, 1977 (Wirral) | |||||||||||||||
|---|---|---|---|---|---|---|---|---|---|---|---|---|---|---|---|
| Party | Candidates | Votes | |||||||||||||
| Stood | Elected | Gained | Unseated | Net | % of total | % | No. | Net % | |||||||
| Conservative | 22 | 17 | 9 | 0 | 77.3 | 60.4 | 64,234 | ||||||||
| Labour | 20 | 3 | 0 | 7 | 13.6 | 21.1 | 22,407 | ||||||||
| Liberal | 22 | 2 | 1 | 3 | 9.1 | 18.0 | 19,141 | ||||||||
| Communist | 3 | 0 | 0 | 0 | 0.0 | 0.2 | 244 | ||||||||
| National Party | 2 | 0 | 0 | 0 | 0.0 | 0.2 | 230 | New | |||||||
| National Front | 1 | 0 | 0 | 0 | 0.0 | 0.1 | 133 | New | |||||||
Turnout: 41.8% (![]() 0.7)
0.7)
Ward results
Results compared directly with the last local election in 1973.
Knowsley
Huyton With Roby No. 1 (Huyton Farm-Princess-Woolfall)
| Party | Candidate | Votes | % | ±% | |
|---|---|---|---|---|---|
| Labour | P. Longfall | 1,126 | 59.6 | ||
| Conservative | A. Gray | 762 | 40.4 | ||
| Majority | 364 | 19.2 | |||
| Registered electors | 9,236 | ||||
| Turnout | 20.5 | ||||
| Labour hold | Swing | ||||
Huyton With Roby No. 2 (Longview and Rupert Farm)
| Party | Candidate | Votes | % | ±% | |
|---|---|---|---|---|---|
| Conservative | J. Easthope | 1,562 | 54.8 | ||
| Labour | C. Frederick | 1,288 | 45.2 | ||
| Majority | 274 | 9.6 | N/A | ||
| Registered electors | 9,067 | ||||
| Turnout | 31.5 | ||||
| Conservative gain from Labour | Swing | ||||
Huyton With Roby No. 3 (St Agnes-St Bartholomews-Swanside)
| Party | Candidate | Votes | % | ±% | |
|---|---|---|---|---|---|
| Conservative | W. Simpson | 4,056 | 77.0 | ||
| Labour | S. Wells | 1,209 | 23.0 | ||
| Majority | 2,847 | 54.0 | |||
| Registered electors | 13,192 | ||||
| Turnout | 40.0 | ||||
| Conservative hold | Swing | ||||
Huyton With Roby No. 4 (St Gabriels and St Michaels)
| Party | Candidate | Votes | % | ±% | |
|---|---|---|---|---|---|
| Labour | S. Powell | 1,718 | 53.2 | ||
| Conservative | C. White | 1,514 | 46.8 | ||
| Majority | 204 | 6.4 | |||
| Registered electors | 11,192 | ||||
| Turnout | 28.9 | ||||
| Labour hold | Swing | ||||
Kirkby No. 1 (Central and Minstead)
| Party | Candidate | Votes | % | ±% | |
|---|---|---|---|---|---|
| Labour | J. King | 1,450 | 56.1 | ||
| Conservative | G. Fogarty | 627 | 24.3 | New | |
| Liberal | R. Jones | 349 | 13.5 | ||
| Communist | J. Myers | 112 | 4.3 | ||
| Independent Labour | T. Ryan | 45 | 1.7 | New | |
| Majority | 823 | 31.8 | |||
| Registered electors | 10,246 | ||||
| Turnout | 25.3 | ||||
| Labour hold | Swing | ||||
Kirkby No. 2 (Cherryfield and Whitfield)
| Party | Candidate | Votes | % | ±% | |
|---|---|---|---|---|---|
| Labour | J. Gallagher | 1,431 | 45.2 | ||
| Conservative | J. Smith | 1,088 | 34.8 | ||
| Liberal | W. McFadden | 510 | 16.3 | ||
| Communist | W. Jones | 116 | 3.7 | ||
| Majority | 325 | 10.4 | |||
| Registered electors | 11,187 | ||||
| Turnout | 28.1 | ||||
| Labour hold | Swing | ||||
Kirkby No. 3 (Northwood-Park-Tower Hill-Simonswood)
| Party | Candidate | Votes | % | ±% | |
|---|---|---|---|---|---|
| Labour | G. Bundred | 1,983 | 52.5 | ||
| Conservative | C. Baily | 1,187 | 31.4 | ||
| Liberal | J. Smith | 413 | 10.9 | New | |
| Communist | T. Bradburn | 194 | 5.1 | ||
| Majority | 796 | 21.1 | |||
| Registered electors | 15,378 | ||||
| Turnout | 3,777 | 24.6 | |||
| Labour hold | Swing | ||||
Prescot
| Party | Candidate | Votes | % | ±% | |
|---|---|---|---|---|---|
| Conservative | W. Hughes | 1,888 | 57.7 | ||
| Labour | W. Howarth | 1,386 | 42.3 | ||
| Majority | 502 | 15.4 | N/A | ||
| Registered electors | 8,654 | ||||
| Turnout | 37.9 | ||||
| Conservative gain from Labour | Swing | ||||
Whiston No. 1 (Croton-Tarbock-Whiston)
| Party | Candidate | Votes | % | ±% | |
|---|---|---|---|---|---|
| Labour | R. Foulkes | 1,444 | 40.1 | ||
| Conservative | S. Pyne | 1,390 | 38.6 | ||
| Ind. Conservative | B. Jeffrey | 765 | 21.3 | New | |
| Majority | 54 | 1.5 | |||
| Registered electors | 11,132 | ||||
| Turnout | 32.6 | ||||
| Labour hold | Swing | ||||
Whiston No. 3 (Halewood)
| Party | Candidate | Votes | % | ±% | |
|---|---|---|---|---|---|
| Conservative | J. Sinclair | 2,488 | 54.3 | ||
| Labour | J. Bohanna | 2,094 | 45.7 | ||
| Majority | 394 | 8.6 | |||
| Registered electors | 14,426 | ||||
| Turnout | 31.8 | ||||
| Conservative gain from Labour | Swing | ||||
Whiston No. 4 (Knowsley)
| Party | Candidate | Votes | % | ±% | |
|---|---|---|---|---|---|
| Labour | W. Alldritt | 1,618 | 51.3 | ||
| Conservative | T. Maudsley | 1,533 | 48.7 | ||
| Majority | 85 | 2.6 | |||
| Registered electors | 11,914 | ||||
| Turnout | 26.5 | ||||
| Labour hold | Swing | ||||
Liverpool
Liverpool No. 1 (Abercromby and St James)
| Party | Candidate | Votes | % | ±% | |
|---|---|---|---|---|---|
| Labour | H. Carr | 1,401 | 57.4 | ||
| Conservative | D. Lewis | 555 | 22.8 | ||
| Communist | R. O'Hara | 253 | 10.4 | ||
| Liberal | P. Bradley | 144 | 5.9 | New | |
| Labour/Liberal | J. Murphy | 86 | 3.5 | New | |
| Majority | 846 | 34.6 | |||
| Registered electors | 12,892 | ||||
| Turnout | 19.0 | ||||
| Labour hold | Swing | ||||
Liverpool No. 2 (Aigburth)
| Party | Candidate | Votes | % | ±% | |
|---|---|---|---|---|---|
| Conservative | S. Moss | 5,159 | 73.7 | ||
| Liberal | P. Message | 1,116 | 15.9 | New | |
| Labour | J. Hughes | 727 | 10.4 | ||
| Majority | 4,043 | 57.8 | |||
| Registered electors | 14,729 | ||||
| Turnout | 7,002 | 47.7 | |||
| Conservative hold | Swing | ||||
Liverpool No. 3 (Allerton)
| Party | Candidate | Votes | % | ±% | |
|---|---|---|---|---|---|
| Conservative | W. Weaver | 3,365 | 73.0 | ||
| Liberal | T. Harte | 651 | 14.1 | ||
| Labour | T. McManus | 592 | 12.8 | ||
| Majority | 2,714 | 58.9 | |||
| Registered electors | 10,683 | ||||
| Turnout | 43.2 | ||||
| Conservative hold | Swing | ||||
Liverpool No. 4 (Anfield)
| Party | Candidate | Votes | % | ±% | |
|---|---|---|---|---|---|
| Conservative | T. Pink | 2,316 | 49.3 | ||
| Labour | F. McGurk | 1,497 | 31.8 | ||
| Liberal | J. Wilmington | 889 | 18.9 | ||
| Majority | 819 | 17.5 | N/A | ||
| Registered electors | 12,682 | ||||
| Turnout | 37.1 | ||||
| Conservative gain from Labour | Swing | ||||
Liverpool No. 5 (Arundel)
| Party | Candidate | Votes | % | ±% | |
|---|---|---|---|---|---|
| Conservative | H. Quayle | 1,872 | 42.7 | ||
| Liberal | G. Scattergood | 1,457 | 33.2 | ||
| Labour | F. Roderick | 885 | 20.2 | ||
| Communist | J. Kay | 171 | 3.9 | New | |
| Majority | 415 | 9.5 | |||
| Registered electors | 13,612 | ||||
| Turnout | 32.3 | ||||
| Conservative gain from Liberal | Swing | ||||
Liverpool No. 6 (Breckfield and St Domingo)
| Party | Candidate | Votes | % | ±% | |
|---|---|---|---|---|---|
| Conservative | J. Butterfield | 1,346 | 40.6 | ||
| Labour | G. Pratt | 1,023 | 30.8 | ||
| Liberal | F. Nevin | 950 | 28.6 | ||
| Majority | 323 | 9.8 | N/A | ||
| Registered electors | 12,035 | ||||
| Turnout | 27.6 | ||||
| Conservative gain from Liberal | Swing | ||||
Liverpool No. 7 (Broadgreen)
| Party | Candidate | Votes | % | ±% | |
|---|---|---|---|---|---|
| Labour | B. Wright | 2,170 | 45.3 | ||
| Liberal | R. Cooper | 1,864 | 38.9 | ||
| Conservative | C. Winter | 753 | 15.7 | ||
| Majority | 306 | 6.4 | N/A | ||
| Registered electors | 12,124 | ||||
| Turnout | 39.5 | ||||
| Labour gain from Liberal | Swing | ||||
Liverpool No. 8 (Central Everton and Netherfield)
| Party | Candidate | Votes | % | ±% | |
|---|---|---|---|---|---|
| Labour | J. Parry | 1,518 | 61.6 | ||
| Conservative | W. Gerrard | 663 | 26.9 | ||
| National Party | M. Holme | 162 | 6.6 | New | |
| Liberal | J. Kelly | 120 | 4.9 | New | |
| Majority | 855 | 34.7 | |||
| Registered electors | 11,676 | ||||
| Turnout | 21.2 | ||||
| Labour hold | Swing | ||||
Liverpool No. 9 (Childwall)
| Party | Candidate | Votes | % | ±% | |
|---|---|---|---|---|---|
| Conservative | C. Henry De Boer | 5,490 | 68.7 | ||
| Conservative | M. Wood | 5,202 | – | – | |
| Liberal | P. Hodgson | 1,333 | 16.7 | ||
| Liberal | F. Ricketts | 1,190 | – | – | |
| Labour | F. Dunne | 1,163 | 14.6 | ||
| Labour | J. Roberts | 1,123 | – | – | |
| Majority | 4,157 | 52.0 | N/A | ||
| Registered electors | 20,372 | ||||
| Turnout | 39.4 | ||||
| Conservative gain from Liberal | Swing | ||||
| Conservative gain from Liberal | Swing | – | |||
Liverpool No. 10 (Church)
| Party | Candidate | Votes | % | ±% | |
|---|---|---|---|---|---|
| Conservative | H. Bolton-Jones | 3,607 | 51.2 | ||
| Liberal | J. Bradley | 2,900 | 41.1 | ||
| Labour | T. Roberts | 543 | 7.7 | ||
| Majority | 707 | 10.1 | N/A | ||
| Registered electors | 15,016 | ||||
| Turnout | 47.1 | ||||
| Conservative gain from Liberal | Swing | ||||
Liverpool No. 11 (Clubmoor)
| Party | Candidate | Votes | % | ±% | |
|---|---|---|---|---|---|
| Conservative | S. Hicklin | 1,512 | 38.8 | ||
| Liberal | J. Bowen | 1,353 | 34.8 | ||
| Labour | P. Rowlands | 1,028 | 26.4 | ||
| Majority | 159 | 4.0 | N/A | ||
| Registered electors | 10,382 | ||||
| Turnout | 37.6 | ||||
| Conservative gain from Liberal | Swing | ||||
Liverpool No. 12 (County)
| Party | Candidate | Votes | % | ±% | |
|---|---|---|---|---|---|
| Conservative | W. Thomas | 1,686 | 39.5 | ||
| Liberal | P. Clark | 1,360 | 31.9 | New | |
| Labour | J. McLean | 1,223 | 28.6 | ||
| Majority | 326 | 7.6 | N/A | ||
| Registered electors | 11,938 | ||||
| Turnout | 35.8 | ||||
| Conservative gain from Labour | Swing | ||||
Liverpool No. 13 (Croxteth)
| Party | Candidate | Votes | % | ±% | |
|---|---|---|---|---|---|
| Conservative | E. Fitzpatrick | 3,200 | 54.3 | ||
| Liberal | G. Holmes | 1,923 | 32.6 | ||
| Labour | J. Hudson | 773 | 13.1 | ||
| Majority | 1,277 | 21.7 | N/A | ||
| Registered electors | 12,244 | ||||
| Turnout | 48.2 | ||||
| Conservative gain from Liberal | Swing | ||||
Liverpool No. 14 (Dingle)
| Party | Candidate | Votes | % | ±% | |
|---|---|---|---|---|---|
| Labour | M. Evans | 980 | 54.1 | ||
| Conservative | J. Watson | 591 | 32.7 | ||
| Liberal | K. Osborne | 163 | 9.0 | ||
| Communist | J. Greig | 76 | 4.2 | ||
| Majority | 389 | 21.5 | |||
| Registered electors | 7,295 | ||||
| Turnout | 24.9 | ||||
| Labour hold | Swing | ||||
Liverpool No. 15 (Dovecot)
| Party | Candidate | Votes | % | ±% | |
|---|---|---|---|---|---|
| Conservative | J. Walsh | 2,141 | 46.0 | ||
| Labour | W. Burke | 1,919 | 41.3 | ||
| Liberal | Rosemary Cooper | 591 | 12.7 | New | |
| Majority | 222 | 4.7 | N/A | ||
| Registered electors | 16,140 | ||||
| Turnout | 28.9 | ||||
| Conservative gain from Labour | Swing | ||||
Liverpool No. 16 (Fairfield)
| Party | Candidate | Votes | % | ±% | |
|---|---|---|---|---|---|
| Conservative | J. Davis | 1,219 | 38.2 | ||
| Liberal | I. Bale | 1,091 | 34.2 | ||
| Labour | S. Gorman | 831 | 26.1 | ||
| National Front | M. Dover | 49 | 1.5 | New | |
| Majority | 128 | 4.0 | N/A | ||
| Registered electors | 10,274 | ||||
| Turnout | 31.1 | ||||
| Conservative gain from Liberal | Swing | ||||
Liverpool No. 17 (Fazakerley)
| Party | Candidate | Votes | % | ±% | |
|---|---|---|---|---|---|
| Conservative | A. Brown | 1,938 | 43.5 | ||
| Labour | A. Williams | 1,305 | 29.3 | ||
| Liberal | N. Cardwell | 1,215 | 27.3 | New | |
| Majority | 633 | 14.2 | N/A | ||
| Registered electors | 11,497 | ||||
| Turnout | 38.9 | ||||
| Conservative gain from Labour | Swing | ||||
Liverpool No. 18 (Gillmoss)
| Party | Candidate | Votes | % | ±% | |
|---|---|---|---|---|---|
| Labour | Edward Loyden | 2,457 | 59.7 | ||
| Labour | K. Stewart | 2,144 | – | – | |
| Conservative | P. Dougherty | 1,658 | 40.3 | ||
| Conservative | P. Ferris | 1,637 | – | – | |
| Majority | 799 | 19.4 | |||
| Registered electors | 19,140 | ||||
| Turnout | 23.4 | ||||
| Labour hold | Swing | ||||
| Labour hold | Swing | – | |||
Liverpool No. 19 (Granby and Princes Park)
| Party | Candidate | Votes | % | ±% | |
|---|---|---|---|---|---|
| Labour | Margaret Simey | 1,545 | 47.2 | ||
| Conservative | T. Staniford | 1,179 | 36.0 | ||
| Liberal | A. Damsell | 376 | 11.5 | New | |
| Communist | M. McClelland | 175 | 5.3 | ||
| Majority | 366 | 11.2 | |||
| Registered electors | 13,467 | ||||
| Turnout | 23.4 | ||||
| Labour hold | Swing | ||||
Liverpool No. 20 (Kensington)
| Party | Candidate | Votes | % | ±% | |
|---|---|---|---|---|---|
| Liberal | F. Doran | 1,340 | 58.2 | ||
| Labour | J. Stamper | 510 | 22.1 | ||
| Conservative | H. Davies | 450 | 19.7 | ||
| Majority | 830 | 36.0 | |||
| Registered electors | 6,525 | ||||
| Turnout | 35.4 | ||||
| Liberal hold | Swing | ||||
Liverpool No. 21 (Low Hill and Smithdown)
| Party | Candidate | Votes | % | ±% | |
|---|---|---|---|---|---|
| Liberal | N. Caple | 1,507 | 53.9 | ||
| Labour | J. Devaney | 892 | 31.9 | ||
| Conservative | D. Jones | 350 | 12.5 | ||
| National Front | S. Hamilton | 46 | 1.6 | New | |
| Majority | 615 | 22.0 | |||
| Registered electors | 8,453 | ||||
| Turnout | 33.1 | ||||
| Liberal hold | Swing | ||||
Liverpool No. 22 (Melrose and Westminster)
| Party | Candidate | Votes | % | ±% | |
|---|---|---|---|---|---|
| Labour | B. Shaw | 1,184 | 59.4 | ||
| Conservative | W. Gilbody | 632 | 31.7 | ||
| Liberal | R. McNally | 177 | 8.9 | New | |
| Majority | 552 | 27.7 | |||
| Registered electors | 7,755 | ||||
| Turnout | 25.8 | ||||
| Labour hold | Swing | ||||
Liverpool No. 23 (Old Swan)
| Party | Candidate | Votes | % | ±% | |
|---|---|---|---|---|---|
| Conservative | W. Bradshaw | 2,044 | 41.4 | ||
| Liberal | D. Jones | 1,780 | 36.1 | ||
| Labour | D. Krumbein | 904 | 18.3 | ||
| Communist | H. Mohin | 124 | 2.5 | New | |
| Independent Liberal | W. McCullough | 83 | 1.7 | ||
| Majority | 264 | 5.3 | N/A | ||
| Registered electors | 12,771 | ||||
| Turnout | 38.7 | ||||
| Conservative gain from Liberal | Swing | ||||
Picton
| Party | Candidate | Votes | % | ±% | |
|---|---|---|---|---|---|
| Liberal | P. Mahon | 1,973 | 43% | ||
| Conservative | W. McGuirk | 1,285 | 28% | ||
| Labour | Robert Wareing | 1,223 | 27% | ||
| Communist | J. G. Volleamere | 78 | 2% | ||
| Majority | 688 | ||||
| Registered electors | 12,225 | ||||
| Turnout | 4,559 | ||||
| Liberal gain from | Swing | ||||
Pirrie
| Party | Candidate | Votes | % | ±% | |
|---|---|---|---|---|---|
| Conservative | I. Brown | 2,393 | 47% | ||
| Labour | H. Dalton | 2,302 | 45% | ||
| Liberal | D. P. J. Turner | 413 | 8% | ||
| Majority | 91 | ||||
| Registered electors | 16,059 | ||||
| Turnout | 5,108 | 32% | |||
| Conservative gain from | Swing | ||||
St. Mary's
| Party | Candidate | Votes | % | ±% | |
|---|---|---|---|---|---|
| Conservative | F. S. Hughes | 1,403 | 46% | ||
| Labour | G. J. Maudsley | 1,191 | 39% | ||
| Liberal | C. J. Lister | 354 | 12% | ||
| Communist | R. Ross | 94 | 3% | ||
| Liberal Union | S. J. Naden | 59 | 2% | ||
| Majority | 212 | ||||
| Registered electors | 10,105 | ||||
| Turnout | 3,042 | 30% | |||
| Conservative gain from | Swing | ||||
St. Michael's
| Party | Candidate | Votes | % | ±% | |
|---|---|---|---|---|---|
| Conservative | R. S. Jones | 1,647 | 46% | ||
| Liberal | Richard Kemp | 1,316 | 37% | ||
| Labour | D. Ralston | 634 | 18% | ||
| Majority | 331 | ||||
| Registered electors | 10,693 | ||||
| Turnout | 3,597 | 34% | |||
| Conservative gain from | Swing | ||||
Sandhills and Vauxhall
| Party | Candidate | Votes | % | ±% | |
|---|---|---|---|---|---|
| Labour | W. H. Sefton | 1,453 | 80% | ||
| Conservative | K. B. Jacques | 238 | 13% | ||
| Liberal | R. J. Cunningham | 128 | 7% | ||
| Majority | 1,215 | 67% | |||
| Registered electors | 10,501 | ||||
| Turnout | 1,819 | 17% | |||
| Labour hold | Swing | ||||
Speke
| Party | Candidate | Votes | % | ±% | |
|---|---|---|---|---|---|
| Labour | Kenneth Stewart | 1,756 | 56% | ||
| Conservative | C. W. Harpin | 1,164 | 37% | ||
| Liberal | A. C. Pistotnick-Howard | 232 | 7% | ||
| Majority | 592 | 19% | |||
| Registered electors | 14,808 | ||||
| Turnout | 3,152 | 21% | |||
| Labour hold | Swing | ||||
Tuebrook
| Party | Candidate | Votes | % | ±% | |
|---|---|---|---|---|---|
| Conservative | D. P. Dougherty | 1,852 | 46% | ||
| Liberal | R. Gore | 1,209 | 30% | ||
| Labour | B. Simpson | 912 | 23% | ||
| Communist | P. B. Bissette | 65 | 2% | ||
| Majority | 643 | ||||
| Registered electors | 11,678 | ||||
| Turnout | 4,038 | 35% | |||
| Conservative gain from | Swing | ||||
Warbreck
| Party | Candidate | Votes | % | ±% | |
|---|---|---|---|---|---|
| Conservative | R. B. Flude | 2,089 | 49% | ||
| Liberal | I. C. Todd | 1,238 | 29% | ||
| Labour | J. Finnegan | 898 | 21% | ||
| Majority | 851 | ||||
| Registered electors | 12,195 | ||||
| Turnout | 4,225 | 35% | |||
| Conservative gain from | Swing | ||||
Woolton East
| Party | Candidate | Votes | % | ±% | |
|---|---|---|---|---|---|
| Labour | L. Evans | 1,786 | 49% | ||
| Conservative | J. H. Kirkham | 1,373 | 38% | ||
| Liberal | Miss G. Loughney | 252 | 7% | ||
| Communist | J. Humes | 211 | 6% | ||
| Majority | 413 | 11% | |||
| Registered electors | 13,002 | ||||
| Turnout | 3,622 | 28% | |||
| Labour hold | Swing | ||||
Woolton West
| Party | Candidate | Votes | % | ±% | |
|---|---|---|---|---|---|
| Conservative | T. L. Hobday | 5,982 | 76% | ||
| Conservative | L. B. Williams | 5,937 | 76% | ||
| Labour | J. M. Lyon | 946 | 12% | ||
| Liberal | Miss A. Smallman | 899 | 11% | ||
| Labour | P. Owens | 874 | 11% | ||
| Liberal | J. B. Kaltiff | 835 | 11% | ||
| Majority | 5,036 | ||||
| Registered electors | 17,820 | ||||
| Turnout | 8,827 | 44% | |||
| Conservative hold | Swing | ||||
| Conservative hold | Swing | ||||
Sefton
Bootle
=
| Party | Candidate | Votes | % | ±% | |
|---|---|---|---|---|---|
| Conservative | F. P. Morris | 1,607 | 48% | ||
| Labour | Hugh Baird | 1,450 | 43% | ||
| Liberal | R. E. Williams | 243 | 7% | ||
| Communist | T. Egan | 74 | 2% | ||
| Majority | 157 | 5% | N/A | ||
| Registered electors | |||||
| Turnout | 3,374 | ||||
| Conservative gain from Labour | Swing | ||||
Linacre and Mersey
| Party | Candidate | Votes | % | ±% | |
|---|---|---|---|---|---|
| Labour | W. A. Wiseman | 1,121 | 59% | ||
| Independent | G. Evason | 465 | 24% | ||
| Conservative | T. I. Percy | 235 | 12% | ||
| Communist | C. P. Curry | 94 | 5% | ||
| Majority | 886 | ||||
| Registered electors | 11,509 | ||||
| Turnout | 1,915 | 17% | |||
| Labour gain from | Swing | ||||
Netherton-Orrell-Sefton
| Party | Candidate | Votes | % | ±% | |
|---|---|---|---|---|---|
| Labour | B. Hillen | 3,217 | 50% | ||
| Labour | J. Riley | 3,126 | 48% | ||
| Conservative | G. Halliwell | 2,981 | 46% | ||
| Conservative | G. Lockley | 2,698 | 42% | ||
| Communist | R. Morris | 263 | 4% | ||
| Majority | 236 | ||||
| Registered electors | 24,169 | ||||
| Turnout | 6,461 | 27% | |||
| Labour gain from | Swing | ||||
| Labour win (new seat) | |||||
Central-College-St. John's
| Party | Candidate | Votes | % | ±% | |
|---|---|---|---|---|---|
| Conservative | N. C. Goldrein | 3,090 | 69% | ||
| Labour | J. E. Ohren | 788 | 17% | ||
| Liberal | G. A. Flaxman | 627 | 17% | ||
| Majority | 2,302 | 52% | |||
| Registered electors | 12,423 | ||||
| Turnout | 4,505 | 36% | |||
| Conservative hold | Swing | ||||
Christ Church-St. Mary's-St. Thomas
| Party | Candidate | Votes | % | ±% | |
|---|---|---|---|---|---|
| Conservative | R. O. Harvey | 1,995 | 56% | ||
| Labour | J. M. Murphy | 1,356 | 38% | ||
| Liberal | J. Sartain | 208 | 6% | ||
| Majority | 639 | ||||
| Registered electors | 10,731 | ||||
| Turnout | 3,559 | 33% | |||
| Conservative gain from | Swing | ||||
East and Little Crosby
| Party | Candidate | Votes | % | ±% | |
|---|---|---|---|---|---|
| Conservative | W. R. Bennett | 2,585 | 72% | ||
| Labour | D. F. Kerr | 706 | 20% | ||
| Liberal | O. Adshead | 275 | 8% | ||
| Majority | 1,879 | ||||
| Registered electors | 9,676 | ||||
| Turnout | 3,566 | 37% | |||
| Conservative gain from | Swing | ||||
North and West
| Party | Candidate | Votes | % | ±% | |
|---|---|---|---|---|---|
| Conservative | F. L. Pritchard | 3,376 | 82% | ||
| Liberal | S. M. Sime | 454 | 11% | ||
| Labour | G. Stringer | 300 | 7% | ||
| Majority | 2,922 | ||||
| Registered electors | 9,076 | ||||
| Turnout | 4,130 | 46% | |||
| Conservative gain from | Swing | ||||
Formby
| Party | Candidate | Votes | % | ±% | |
|---|---|---|---|---|---|
| Conservative | Sir K. P. Thompson | 5,758 | 81% | ||
| Liberal | M. J. Metcalf | 1,376 | 19% | ||
| Majority | 4,382 | ||||
| Registered electors | 16,537 | ||||
| Turnout | 7,134 | 43% | |||
| Conservative gain from | Swing | ||||
Litherland
| Party | Candidate | Votes | % | ±% | |
|---|---|---|---|---|---|
| Conservative | Mrs. G. Buckles | 2,653 | 48% | ||
| Labour | O. F. Brady | 2,445 | 44% | ||
| Liberal | K. Holding | 367 | 7% | ||
| Communist | J. Hulligan | 81 | 1.5% | ||
| Majority | 208 | ||||
| Registered electors | 16,515 | ||||
| Turnout | 5,546 | 34% | |||
| Conservative gain from | Swing | ||||
Ainsdale-Birkdale-South
| Party | Candidate | Votes | % | ±% | |
|---|---|---|---|---|---|
| Conservative | J. Hartley | 3,774 | 87% | ||
| Liberal | J. S. M. White | 961 | 26% | ||
| Labour | J. F. Caven | 436 | 10% | ||
| Majority | 1,263 | 61% | |||
| Registered electors | 11,286 | ||||
| Turnout | 3,740 | 33% | |||
| Conservative gain from | Swing | ||||
Birkdale East-Birkdale North-South
| Party | Candidate | Votes | % | ±% | |
|---|---|---|---|---|---|
| Conservative | C. Rawstron | 2,224 | 59% | ||
| Liberal | G. S. M. White | 961 | 26% | ||
| Labour | W. P. Lafferty | 555 | 15% | ||
| Majority | 1,263 | ||||
| Registered electors | 11,286 | ||||
| Turnout | 3.740 | 33% | |||
| Conservative gain from | Swing | ||||
Birkdale West-Central-West
| Party | Candidate | Votes | % | ±% | |
|---|---|---|---|---|---|
| Conservative | J. S. Mitchell | 2,385 | 78% | ||
| Liberal | E. E. Rothwell | 654 | 22% | ||
| Majority | 1,731 | ||||
| Registered electors | 9,023 | ||||
| Turnout | 3,039 | 34% | |||
| Conservative gain from | Swing | ||||
Craven-Sussex-Talbot
| Party | Candidate | Votes | % | ±% | |
|---|---|---|---|---|---|
| Liberal | Ronald Fearn | 2,438 | 50% | ||
| Conservative | B. Dawson | 1,921 | 40% | ||
| Labour | G. A. Fenerty | 476 | 10% | ||
| Majority | 517 | ||||
| Registered electors | 11,406 | ||||
| Turnout | 4,835 | 42% | |||
| Conservative gain from | Swing | ||||
Hesketh and Scarisbrick
| Party | Candidate | Votes | % | ±% | |
|---|---|---|---|---|---|
| Conservative | Mrs. J. Leech | 2,977 | 56% | ||
| Liberal | P. J. Handley | 1,848 | 35% | ||
| Labour | J. J. Abram | 474 | 9% | ||
| Majority | 1,129 | ||||
| Registered electors | 10,525 | ||||
| Turnout | 5,299 | 50% | |||
| Conservative gain from | Swing | ||||
Marine and Park
| Party | Candidate | Votes | % | ±% | |
|---|---|---|---|---|---|
| Conservative | W. Brown | 2,712 | 67% | ||
| Liberal | P. F. Reilly | 1,324 | 33% | ||
| Majority | 1,388 | ||||
| Registered electors | 10,436 | ||||
| Turnout | 4,036 | 39% | |||
| Conservative gain from | Swing | ||||
West Lancs No. 1
| Party | Candidate | Votes | % | ±% | |
|---|---|---|---|---|---|
| Conservative | A. I. Birch | 3,282 | 83% | ||
| Labour | A. Riley | 681 | 17% | ||
| Majority | 2,601 | ||||
| Registered electors | 11,455 | ||||
| Turnout | 3,963 | 35% | |||
| Conservative gain from | Swing | ||||
St. Helens
Haydock
| Party | Candidate | Votes | % | ±% | |
|---|---|---|---|---|---|
| Conservative | P. Anderton | 2,969 | 55% | ||
| Labour | C. Davies | 2,396 | 45% | ||
| Majority | 573 | ||||
| Registered electors | 11,022 | ||||
| Turnout | 5,365 | 49% | |||
| Conservative gain from | Swing | ||||
Newton-Le-Willows
| Party | Candidate | Votes | % | ±% | |
|---|---|---|---|---|---|
| Labour | O. Conheeney | 2,920 | 45% | ||
| Conservative | Miss M. Monks | 2,686 | 41% | ||
| Liberal | R. Birch | 910 | 14% | ||
| Majority | 234 | ||||
| Registered electors | 16,022 | ||||
| Turnout | 6,516 | 41% | |||
| Labour gain from | Swing | ||||
Rainford
| Party | Candidate | Votes | % | ±% | |
|---|---|---|---|---|---|
| Conservative | Mrs. A. Berry | 5,270 | 78% | ||
| Labour | R. Cliff | 1,479 | 22% | ||
| Majority | 3,971 | ||||
| Registered electors | 14,053 | ||||
| Turnout | 6,749 | 48% | |||
| Conservative gain from | Swing | ||||
Central and South Eccleston
| Party | Candidate | Votes | % | ±% | |
|---|---|---|---|---|---|
| Conservative | Mrs. E. Jameson | 1,920 | 54% | ||
| Labour | L. Williams | 1,380 | 39% | ||
| Liberal | W. Iley | 260 | 7% | ||
| Majority | 540 | ||||
| Registered electors | 10,259 | ||||
| Turnout | 3,560 | 35% | |||
| Conservative gain from | Swing | ||||
East Sutton
| Party | Candidate | Votes | % | ±% | |
|---|---|---|---|---|---|
| Conservative | P. Harrison | 1,632 | 47% | ||
| Labour | E. Maguire | 1,496 | 43% | ||
| Liberal | J. Bentham | 354 | 10% | ||
| Majority | 136 | ||||
| Registered electors | 11,760 | ||||
| Turnout | 3,482 | 30% | |||
| Conservative gain from | Swing | ||||
Hardshaw and West Sutton
| Party | Candidate | Votes | % | ±% | |
|---|---|---|---|---|---|
| Labour | H. Glover | 2,062 | 44% | ||
| Conservative | T. Webster | 1,713 | 37% | ||
| Liberal | T. Gilligan | 863 | 19% | ||
| Majority | 349 | ||||
| Registered electors | 15,565 | ||||
| Turnout | 4,638 | 30% | |||
| Labour gain from | Swing | ||||
Moss Bank and North Windle
| Party | Candidate | Votes | % | ±% | |
|---|---|---|---|---|---|
| Conservative | E. Jameson | 3,364 | 63% | ||
| Labour | N. Wilson | 1,770 | 33% | ||
| Liberal | M. A. Kelly | 227 | 4% | ||
| Majority | 1,594 | ||||
| Registered electors | 13,452 | ||||
| Turnout | 5,361 | 40% | |||
| Conservative gain from | Swing | ||||
North Eccleston and South Windle
| Party | Candidate | Votes | % | ±% | |
|---|---|---|---|---|---|
| Conservative | E. Clough | 1,706 | 64% | ||
| Labour | J. Morris | 953 | 36% | ||
| Majority | 754 | ||||
| Registered electors | 8,471 | ||||
| Turnout | 2,659 | 31% | |||
| Conservative gain from | Swing | ||||
Parr
| Party | Candidate | Votes | % | ±% | |
|---|---|---|---|---|---|
| Labour | F. Mernagh | 2,272 | 55% | ||
| Conservative | C. Foster | 1,625 | 39% | ||
| Liberal | I. Rigby | 236 | 6% | ||
| Majority | 647 | ||||
| Registered electors | 16,313 | ||||
| Turnout | 25% | ||||
| Labour gain from | Swing | ||||
Eccleston and Windle
| Party | Candidate | Votes | % | ±% | |
|---|---|---|---|---|---|
| Conservative | G. Brownlow | 3,954 | 88% | ||
| Labour | B. Hamilton | 562 | 12% | ||
| Majority | 3,392 | ||||
| Registered electors | 9,404 | ||||
| Turnout | 4,516 | 48% | |||
| Conservative gain from | Swing | ||||
Rainhill and Bold
| Party | Candidate | Votes | % | ±% | |
|---|---|---|---|---|---|
| Conservative | Nellie Holley | 2,866 | 68% | ||
| Labour | E. Norris | 1,375 | 32% | ||
| Majority | 1,491 | ||||
| Registered electors | 16,497 | ||||
| Turnout | 4,241 | 26% | |||
| Conservative gain from | Swing | ||||
Wirral
Higher Bebington and Woodhey
| Party | Candidate | Votes | % | ±% | |
|---|---|---|---|---|---|
| Conservative | H. Harriman | 3,805 | 80% | ||
| Liberal | Jean Walker | 970 | 20% | ||
| Majority | 2,835 | ||||
| Registered electors | 10,279 | ||||
| Turnout | 4,775 | 46% | |||
| Conservative gain from | Swing | ||||
Sunlight-Park-New Ferry-North Bromborough
| Party | Candidate | Votes | % | ±% | |
|---|---|---|---|---|---|
| Conservative | E. A. Davies | 2,138 | 51% | ||
| Labour | B. A. Bryning | 1,709 | 41% | ||
| Liberal | P. J. Taylor | 314 | 8% | ||
| Majority | 429 | ||||
| Registered electors | 9,776 | ||||
| Turnout | 4,161 | 43% | |||
| Conservative gain from | Swing | ||||
South Bromborough and Eastham
| Party | Candidate | Votes | % | ±% | |
|---|---|---|---|---|---|
| Liberal | Phillip Gilchrist | 2,816 | 45% | ||
| Conservative | L. Chrishop | 2,256 | 36% | ||
| Labour | A. E. S. Rose | 1,237 | 20% | ||
| Majority | 560 | ||||
| Registered electors | 12,857 | ||||
| Turnout | 6,309 | 49% | |||
| Liberal gain from | Swing | ||||
Lower Bebington-Poulton-Sunlight-South Bromborough
| Party | Candidate | Votes | % | ±% | |
|---|---|---|---|---|---|
| Conservative | F. J. K. Williams | 4,619 | 78% | ||
| Liberal | Thomas Harney | 1,321 | 22% | ||
| Majority | 560 | ||||
| Registered electors | 12,002 | ||||
| Turnout | 5,940 | 49% | |||
| Conservative gain from | Swing | ||||
Argyle-Clifton-Holt
| Party | Candidate | Votes | % | ±% | |
|---|---|---|---|---|---|
| Labour | J. Stuart-Cole | 1,290 | 50% | ||
| Conservative | R. Entwistle | 716 | 28% | ||
| Liberal | M. R. D. Gayford | 403 | 16% | ||
| National Party | D. M. Matthews | 117 | 5% | ||
| Communist (Young Communist League (Great Britain)) | J. E. Norris | 69 | 3% | ||
| Majority | 574 | ||||
| Registered electors | 8,985 | ||||
| Turnout | 2,595 | 29% | |||
| Labour gain from | Swing | ||||
Bebington and Mersey
| Party | Candidate | Votes | % | ±% | |
|---|---|---|---|---|---|
| Conservative | H. Welsh | 1,402 | 49% | ||
| Labour | C. S. McRonald | 1,258 | 44% | ||
| Liberal | T. J. Edwards | 190 | 7% | ||
| Majority | 144 | ||||
| Registered electors | 8,707 | ||||
| Turnout | 2,850 | 33% | |||
| Conservative gain from | Swing | ||||
Cathcart-Claughton-Cleveland
| Party | Candidate | Votes | % | ±% | |
|---|---|---|---|---|---|
| Liberal | David Gruffydd Evans | 1,826 | 55% | ||
| Conservative | George Porter | 1,395 | 42% | ||
| Labour | Walter Smith | 102 | 3% | ||
| Majority | 431 | ||||
| Registered electors | 9,993 | ||||
| Turnout | 3,323 | 33% | |||
| Liberal gain from | Swing | ||||
Devonshire and Egerton
| Party | Candidate | Votes | % | ±% | |
|---|---|---|---|---|---|
| Conservative | W. R. Baker | 2,223 | 44% | ||
| Liberal | D. W. Hughes | 1,600 | 32% | ||
| Labour | G. Kenyon | 1,202 | 24% | ||
| Majority | 624 | ||||
| Registered electors | 12,461 | ||||
| Turnout | 5,025 | 40% | |||
| Conservative gain from | Swing | ||||
Gilbrook and St. James
| Party | Candidate | Votes | % | ±% | |
|---|---|---|---|---|---|
| Labour | J. R. A. Flynn | 1,702 | 58% | ||
| Conservative | R. A. Hodgkinson | 629 | 22% | ||
| Liberal | E. Rose | 593 | 20% | ||
| Majority | 1,073 | ||||
| Registered electors | 9,030 | ||||
| Turnout | 2,924 | 32% | |||
| Labour gain from | Swing | ||||
Grange and Oxton
| Party | Candidate | Votes | % | ±% | |
|---|---|---|---|---|---|
| Conservative | F. J. Moreton | 2,673 | 45% | ||
| Liberal | Gordon Lindsay | 2,295 | 39% | ||
| Labour | D. J. Healey | 833 | 14% | ||
| National Party | W. R. Williams | 113 | 2% | ||
| Majority | 378 | ||||
| Registered electors | 12,348 | ||||
| Turnout | 5,914 | 48% | |||
| Conservative gain from | Swing | ||||
Prenton
| Party | Candidate | Votes | % | ±% | |
|---|---|---|---|---|---|
| Conservative | A. E. Wise | 3,638 | 65% | ||
| Labour | W. R. Leslie | 1,465 | 26% | ||
| Liberal | E. J. Banton | 474 | 8% | ||
| Majority | 2,173 | ||||
| Registered electors | 15,882 | ||||
| Turnout | 5,577 | 35% | |||
| Conservative gain from | Swing | ||||
Upton
| Party | Candidate | Votes | % | ±% | |
|---|---|---|---|---|---|
| Conservative | Mrs. S. E. Hibbert | 3,990 | 61% | ||
| Labour | E. C. Ainslie | 2,071 | 32% | ||
| Liberal | A. B. Halliday | 470 | 7% | ||
| Majority | 1,919 | ||||
| Registered electors | 19,861 | ||||
| Turnout | 6,531 | 33% | |||
| Conservative gain from | Swing | ||||
Caldy-Frankby-Grange-Newton-Greasby-South
| Party | Candidate | Votes | % | ±% | |
|---|---|---|---|---|---|
| Conservative | H. H. H. Needham | 4,471 | 82% | ||
| Labour | J. Seaman | 500 | 9% | ||
| Liberal | E. L. Fell | 495 | 5% | ||
| Majority | 3,971 | ||||
| Registered electors | 12,684 | ||||
| Turnout | 5,466 | 43% | |||
| Conservative gain from | Swing | ||||
Central-Hoose-Meols-Park
| Party | Candidate | Votes | % | ±% | |
|---|---|---|---|---|---|
| Conservative | J. W. Last | 4,570 | 78% | ||
| Liberal | I. Smith | 897 | 15% | ||
| Labour | David Jackson | 406 | 7% | ||
| Majority | 3,673 | ||||
| Registered electors | 11,992 | ||||
| Turnout | 5,873 | 49% | |||
| Conservative gain from | Swing | ||||
Leasowe
| Party | Candidate | Votes | % | ±% | |
|---|---|---|---|---|---|
| Conservative | K. R. Young | 1,943 | 47% | ||
| Labour | Bill Wells | 1,793 | 44% | ||
| Liberal | G. J. Canning | 250 | 6% | ||
| National Front | John Fishwick | 133 | 3% | ||
| Majority | 150 | ||||
| Registered electors | 11,464 | ||||
| Turnout | 4,119 | 36% | |||
| Conservative gain from | Swing | ||||
Marlowe-North Egremont-South Egremont-South
| Party | Candidate | Votes | % | ±% | |
|---|---|---|---|---|---|
| Conservative | B. J. Frisby | 3,150 | 63% | ||
| Labour | A. R. Chowderoy | 1,362 | 27% | ||
| Liberal | N. R. L. Thomas | 523 | 10% | ||
| Majority | 1,788 | ||||
| Registered electors | |||||
| Turnout | 5,035 | ||||
| Conservative gain from | Swing | ||||
Moreton and Saughall Massie
| Party | Candidate | Votes | % | ±% | |
|---|---|---|---|---|---|
| Conservative | I. W. Allison | 1,951 | 66% | ||
| Labour | C. Allman | 873 | 29% | ||
| Liberal | J. C. Jenkins | 154 | 5% | ||
| Majority | 1,078 | ||||
| Registered electors | 7,070 | ||||
| Turnout | 2,978 | 42% | |||
| Conservative gain from | Swing | ||||
New Brighton-Wallasey-Warren
| Party | Candidate | Votes | % | ±% | |
|---|---|---|---|---|---|
| Conservative | M. F. Emberton | 5,394 | 69% | ||
| Liberal | Mrs. Kathleen Bowes | 2,036 | 26% | ||
| Labour | Mrs. Beryl Lloyd | 335 | 4% | ||
| Majority | 3,358 | ||||
| Registered electors | 14,673 | ||||
| Turnout | 7,765 | 53% | |||
| Conservative gain from | Swing | ||||
North Liscard-Upper Brighton-St. Hilary
| Party | Candidate | Votes | % | ±% | |
|---|---|---|---|---|---|
| Conservative | K. W. Porter | 3,362 | 76% | ||
| Labour | M. D. Laskier | 647 | 15% | ||
| Liberal | J. S. C. Timothy | 401 | 9% | ||
| Majority | 2,715 | ||||
| Registered electors | 11,774 | ||||
| Turnout | 4,410 | 37% | |||
| Conservative gain from | Swing | ||||
North Seacombe-Poulton-Somerville-South
| Party | Candidate | Votes | % | ±% | |
|---|---|---|---|---|---|
| Labour | J. Gersham | 1,916 | 46% | ||
| Conservative | Mrs. Marie Kemble | 1,829 | 44% | ||
| Liberal | P. C. Mawdsley | 346 | 8% | ||
| Communist | R. B. Harris | 93 | 2% | ||
| Majority | 87 | ||||
| Registered electors | 12,427 | ||||
| Turnout | 4,184 | 34% | |||
| Labour gain from | Swing | ||||
Barnston-Gayton-Heswall-Oldfield
| Party | Candidate | Votes | % | ±% | |
|---|---|---|---|---|---|
| Conservative | J. C. Smyth | 4,840 | 88% | ||
| Liberal | R. W. Thomas | 355 | 6% | ||
| Labour | J. F. Durrant | 286 | 5% | ||
| Majority | 4,485 | ||||
| Registered electors | 11,022 | ||||
| Turnout | 5,481 | 46% | |||
| Conservative gain from | Swing | ||||
Irby and Thursaton-Irby South-Pensby
| Party | Candidate | Votes | % | ±% | |
|---|---|---|---|---|---|
| Conservative | F. K. Burlinson | 3,240 | 76% | ||
| Labour | H. Ellis-Thomas | 620 | 15% | ||
| Liberal | G. A. Collins | 391 | 9% | ||
| Majority | 2,620 | ||||
| Registered electors | 9,147 | ||||
| Turnout | 4,251 | 46% | |||
| Conservative gain from | Swing | ||||
Notes
• italics denote the sitting councillor • bold denotes the winning candidate
References
- 1 2 3 4 5 6 7 8 "Local Election Summaries 1977". The Elections Centre. Retrieved 1 December 2018.
- ↑ Jeffery, David. "Merseyside Local Election Results Project". Dr David Jeffery. Retrieved 6 May 2021.
- 1 2 3 4 5 6 7 8 9 10 11 12 13 14 15 16 17 18 19 20 21 22 23 24 25 26 27 28 29 30 31 32 33 Rallings, Colin; Thrasher, Michael. Local Elections Handbook 1977. The Elections Centre. Retrieved 5 December 2018.
"…on night of Labour slaughter…". Liverpool Daily Post. 6 May 1977. Retrieved 25 February 2017.
"LABOUR SUNK BY TORY'S BLUE TIDE". Liverpool Echo. 6 May 1977. Retrieved 12 March 2017.
| County councils (England) |
|
|---|---|
| County councils (Wales) |
|
| Unicameral area | |
| District councils (Scotland) |
|
| District councils (Northern Ireland) | |
| Sui generis |
|
This article is issued from Wikipedia. The text is licensed under Creative Commons - Attribution - Sharealike. Additional terms may apply for the media files.