| Vatakara | |
|---|---|
| Lok Sabha constituency | |
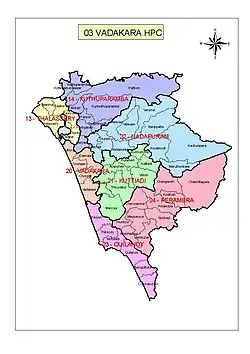 Map of Vatakara Parliament Constituency | |
| Constituency details | |
| Country | India |
| Region | South India |
| State | Kerala |
| Assembly constituencies | Thalassery Kuthuparamba Vatakara Kuttiady Nadapuram Koyilandy Perambra |
| Established | 1957 |
| Total electors | 12,86,250 (2019) |
| Reservation | None |
| Member of Parliament | |
| 17th Lok Sabha | |
| Incumbent | |
| Party | INC |
| Elected year | 2019 |
Vatakara Lok Sabha constituency (Malayalam: വടകര ലോക്സഭാ നിയോജക മണ്ഡലം) is one of the 20 Lok Sabha (parliamentary) constituencies in Kerala state in southern India.
Assembly segments
Vatakara Lok Sabha constituency is composed of the following assembly segments:[1]
| No | Name | District | Member | Party | |
|---|---|---|---|---|---|
| 13 | Thalassery | Kannur | A. N. Shamseer | Communist Party of India | |
| 14 | Kuthuparamba | K. P. Mohanan | Loktantrik Janata Dal | ||
| 20 | Vatakara | Kozhikode | K. K. Rema | Revolutionary Marxist Party of India | |
| 21 | Kuttiady | K. P. Kunhahammed Kutty | Communist Party of India | ||
| 22 | Nadapuram | E. K. Vijayan | Communist Party of India | ||
| 23 | Koyilandy | Kanathil Jameela | Communist Party of India | ||
| 24 | Perambra | T. P. Ramakrishnan | Communist Party of India | ||
Members of Parliament
Election results
General Elections 2019
| Party | Candidate | Votes | % | ±% | |
|---|---|---|---|---|---|
| INC | K. Muraleedharan | 526,755 | 49.81% | 6.40% | |
| CPI(M) | P. Jayarajan | 4,42,092 | 41.81% | -1.26% | |
| BJP | V. K. Sajeevan | 80,128 | 7.58% | -0.38% | |
| SDPI | Musthafa Kommeri | 5,544 | 0.52% | -1.05% | |
| Margin of victory | 84,663 | 8.01% | 7.66% | ||
| Turnout | 10,57,440 | 82.70% | 0.91% | ||
| Registered electors | 12,88,926 | 9.00% | |||
| INC hold | Swing | 6.40% | |||
General Elections 2014
| Party | Candidate | Votes | % | ±% | |
|---|---|---|---|---|---|
| INC | Mullappally Ramachandran | 416,479 | 43.41% | -5.41% | |
| CPI(M) | A. N. Shamseer | 4,13,173 | 43.07% | 0.76% | |
| BJP | V. K. Sajeevan | 76,313 | 7.95% | 3.27% | |
| Independent | P. Kumarankutty | 17,229 | 1.80% | ||
| SDPI | P. Abdul Hameed Master | 15,058 | 1.57% | ||
| AAP | Ali Akbar | 6,245 | 0.65% | ||
| NOTA | None of the Above | 6,107 | 0.64% | ||
| Margin of victory | 3,306 | 0.34% | -6.17% | ||
| Turnout | 9,59,342 | 81.21% | 0.58% | ||
| Registered electors | 11,82,504 | 10.39% | |||
| INC hold | Swing | -5.41% | |||
General Elections 2009
| Party | Candidate | Votes | % | ±% | |
|---|---|---|---|---|---|
| INC | Mullappally Ramachandran | 421,255 | 48.82% | 12.77% | |
| CPI(M) | P. Satheedevi | 3,65,069 | 42.31% | -9.50% | |
| BJP | K. P Sreesan | 40,391 | 4.68% | -5.20% | |
| Independent | T. P. Chandrasekharan | 21,833 | 2.53% | ||
| BSP | K. Noorudheen Musaliar | 4,481 | 0.52% | ||
| Margin of victory | 56,186 | 6.51% | -9.25% | ||
| Turnout | 8,62,844 | 80.58% | 4.74% | ||
| Registered electors | 10,71,171 | -1.98% | |||
| INC gain from CPI(M) | Swing | -2.99% | |||
General Elections 2004
| Party | Candidate | Votes | % | ±% | |
|---|---|---|---|---|---|
| CPI(M) | P. Sathidevi | 429,294 | 51.81% | 4.67% | |
| INC | M. T. Padma | 2,98,705 | 36.05% | -8.08% | |
| BJP | K. P. Sreesan | 81,901 | 9.89% | 2.59% | |
| Independent | K. T. Kunhikannan | 7,482 | 0.90% | ||
| Independent | Dr. K. N. Ajoy Kumar | 7,306 | 0.88% | ||
| Independent | T. K. Kalandan Haje | 3,845 | 0.46% | ||
| Margin of victory | 1,30,589 | 15.76% | 12.75% | ||
| Turnout | 8,28,533 | 75.83% | 1.25% | ||
| Registered electors | 10,92,826 | -5.46% | |||
| CPI(M) hold | Swing | 4.67% | |||
General Elections 1999
| Party | Candidate | Votes | % | ±% | |
|---|---|---|---|---|---|
| CPI(M) | A. K. Premajam | 404,355 | 47.15% | -1.35% | |
| INC | P. M. Suresh Babu | 3,78,511 | 44.13% | 2.67% | |
| BJP | O. K. Vasumaster | 62,593 | 7.30% | -0.97% | |
| Independent | Dr. K. N. Ajoy Kumar | 10,708 | 1.25% | ||
| Margin of victory | 25,844 | 3.01% | -4.02% | ||
| Turnout | 8,57,638 | 74.57% | -1.16% | ||
| Registered electors | 11,55,934 | 2.74% | |||
| CPI(M) hold | Swing | -4.02% | |||
General Elections 1998
| Party | Candidate | Votes | % | ±% | |
|---|---|---|---|---|---|
| CPI(M) | A. K. Premajam | 407,876 | 48.50% | -2.67% | |
| INC | P. M. Suresh Babu | 3,48,715 | 41.47% | 0.13% | |
| BJP | Chettoor Balakrishnan Master | 69,564 | 8.27% | 2.12% | |
| INL | P. K. Radhakrishnan | 11,965 | 1.42% | ||
| Margin of victory | 59,161 | 7.03% | -2.80% | ||
| Turnout | 8,40,958 | 75.13% | -0.60% | ||
| Registered electors | 11,25,076 | 3.24% | |||
| CPI(M) hold | Swing | -2.67% | |||
General Elections 1996
| Party | Candidate | Votes | % | ±% | |
|---|---|---|---|---|---|
| CPI(M) | O. Bharathan | 415,895 | 51.17% | ||
| INC | K. P. Unnikrishnan | 3,35,950 | 41.33% | ||
| BJP | A. D. Nair | 49,971 | 6.15% | ||
| Margin of victory | 79,945 | 9.84% | 7.63% | ||
| Turnout | 8,12,773 | 75.73% | -1.95% | ||
| Registered electors | 10,89,716 | 5.77% | |||
| CPI(M) gain from INS(SCS) | Swing | 1.20% | |||
General Elections 1991
| Party | Candidate | Votes | % | ±% | |
|---|---|---|---|---|---|
| INS(SCS) | K. P. Unnikrishnan | 395,501 | 49.97% | ||
| Independent | M. Ratnasingh | 3,78,012 | 47.76% | ||
| Independent | P. Unnikrishnan | 8,566 | 1.08% | ||
| JP | S. K. Madhavan | 4,213 | 0.53% | ||
| Margin of victory | 17,489 | 2.21% | 1.17% | ||
| Turnout | 7,91,474 | 77.67% | -3.18% | ||
| Registered electors | 10,30,244 | 4.67% | |||
| INS(SCS) hold | Swing | 3.21% | |||
General Elections 1989
| Party | Candidate | Votes | % | ±% | |
|---|---|---|---|---|---|
| INS(SCS) | K. P. Unnikrishnan | 370,434 | 46.76% | ||
| INC | A. Sujanapal | 3,62,225 | 45.73% | ||
| BJP | P. K. Krishnadas | 45,558 | 5.75% | -0.08% | |
| Independent | T. K. Kalandan Haji | 6,198 | 0.78% | ||
| Margin of victory | 8,209 | 1.04% | -0.86% | ||
| Turnout | 7,92,162 | 80.85% | 2.04% | ||
| Registered electors | 9,84,309 | 32.94% | |||
| INS(SCS) gain from IC(S) | Swing | 0.10% | |||
General Elections 1984
| Party | Candidate | Votes | % | ±% | |
|---|---|---|---|---|---|
| IC(S) | K. P. Unnikrishnan | 270,416 | 46.67% | ||
| Independent | K. M. Radhakrishnan | 2,59,437 | 44.77% | ||
| BJP | A. D. Nair | 33,781 | 5.83% | ||
| Independent | B. M. Sasthri | 10,556 | 1.82% | ||
| Margin of victory | 10,979 | 1.89% | -6.41% | ||
| Turnout | 5,79,462 | 78.81% | 4.96% | ||
| Registered electors | 7,40,431 | 7.99% | |||
| IC(S) gain from INC(U) | Swing | -7.49% | |||
General Elections 1980
| Party | Candidate | Votes | % | ±% | |
|---|---|---|---|---|---|
| INC(U) | K. P. Unnikrishnan | 271,796 | 54.15% | ||
| INC(I) | Mullappally Ramachandran | 2,30,114 | 45.85% | ||
| Margin of victory | 41,682 | 8.30% | 6.69% | ||
| Turnout | 5,01,910 | 73.85% | -9.13% | ||
| Registered electors | 6,85,632 | 12.20% | |||
| INC(U) gain from INC | Swing | 3.34% | |||
General Elections 1977
| Party | Candidate | Votes | % | ±% | |
|---|---|---|---|---|---|
| INC | K. P. Unnikrishnan | 253,462 | 50.81% | -2.07% | |
| BLD | Arangil Sreedharan | 2,45,392 | 49.19% | ||
| Margin of victory | 8,070 | 1.62% | -13.75% | ||
| Turnout | 4,98,854 | 82.98% | 15.92% | ||
| Registered electors | 6,11,107 | 7.83% | |||
| INC hold | Swing | -2.07% | |||
General Elections 1971
| Party | Candidate | Votes | % | ±% | |
|---|---|---|---|---|---|
| INC | K. P. Unnikrishnan | 198,939 | 52.88% | 18.08% | |
| Independent | A. V. Raghavan | 1,41,135 | 37.52% | ||
| Indian Socialist Party | Arangil Sreedharan | 33,893 | 9.01% | ||
| Independent | Leela Damodara Menon | 2,236 | 0.59% | ||
| Margin of victory | 57,804 | 15.37% | -15.03% | ||
| Turnout | 3,76,203 | 67.06% | -7.46% | ||
| Registered electors | 5,66,738 | 22.39% | |||
| INC gain from SSP | Swing | -12.32% | |||
General Elections 1967
| Party | Candidate | Votes | % | ±% | |
|---|---|---|---|---|---|
| SSP | Arangil Sreedharan | 215,597 | 65.20% | ||
| INC | M. K. Prabhakaran | 1,15,094 | 34.80% | ||
| Margin of victory | 1,00,503 | 30.39% | 8.68% | ||
| Turnout | 3,30,691 | 74.51% | 0.44% | ||
| Registered electors | 4,63,046 | -0.10% | |||
| SSP gain from Independent | Swing | 4.34% | |||
General Elections 1962
| Party | Candidate | Votes | % | ±% | |
|---|---|---|---|---|---|
| Independent | A. V. Raghavan | 204,315 | 60.86% | ||
| PSP | K. B. Menon | 1,31,408 | 39.14% | ||
| Margin of victory | 72,907 | 21.72% | 15.35% | ||
| Turnout | 3,35,723 | 74.07% | 7.94% | ||
| Registered electors | 4,63,498 | 3.66% | |||
| Independent gain from PSP | Swing | 23.17% | |||
General Elections 1957
| Party | Candidate | Votes | % | ±% | |
|---|---|---|---|---|---|
| PSP | K. B. Menon | 111,425 | 37.68% | ||
| INC | Gopalan Karipur | 92,606 | 31.32% | ||
| CPI | P. Ramunni Nambiar | 91,651 | 31.00% | ||
| Margin of victory | 18,819 | 6.36% | |||
| Turnout | 2,95,682 | 66.13% | |||
| Registered electors | 4,47,129 | ||||
| PSP win (new seat) | |||||
See also
References
- ↑ "Assembly Constituencies - Corresponding Districts and Parliamentary Constituencies" (PDF). Kerala. Election Commission of India. Archived from the original (PDF) on 30 October 2008. Retrieved 19 October 2008.
External links
- Election Commission of India: https://web.archive.org/web/20081218010942/http://www.eci.gov.in/StatisticalReports/ElectionStatistics.asp
- 2019 Vadakara Constituency Lok Sabha Election Results
- Vadakara Lok Sabha Elections Asianet News survey results 2019
Lok Sabha constituencies of Kerala | ||
|---|---|---|
| Current |  | |
| Defunct |
| |
This article is issued from Wikipedia. The text is licensed under Creative Commons - Attribution - Sharealike. Additional terms may apply for the media files.