| ||||||||||||||||||||||||||||||||||||||||||||||||||||||||||||||||||||
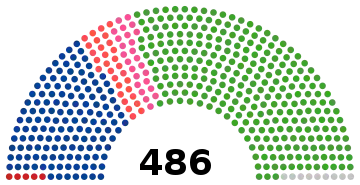
All 486 seats in the House of Representatives 244 seats needed for a majority | ||||||||||||||||||||||||||||||||||||||||||||||||||||||||||||||||||||
|---|---|---|---|---|---|---|---|---|---|---|---|---|---|---|---|---|---|---|---|---|---|---|---|---|---|---|---|---|---|---|---|---|---|---|---|---|---|---|---|---|---|---|---|---|---|---|---|---|---|---|---|---|---|---|---|---|---|---|---|---|---|---|---|---|---|---|---|---|
| Turnout | 73.98% ( | |||||||||||||||||||||||||||||||||||||||||||||||||||||||||||||||||||
| ||||||||||||||||||||||||||||||||||||||||||||||||||||||||||||||||||||
 | ||||||||||||||||||||||||||||||||||||||||||||||||||||||||||||||||||||
.jpg.webp)
| This article is part of a series on |
| Politics of Japan |
|---|
 |
|
|
|
|
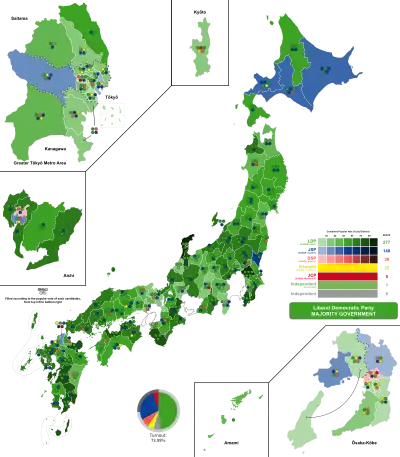
General elections were held in Japan on 29 January 1967. The result was a victory for the Liberal Democratic Party, which won 277 of the 486 seats.[1] Voter turnout was 73.99%.
Results
 | |||||
|---|---|---|---|---|---|
| Party | Votes | % | Seats | +/– | |
| Liberal Democratic Party | 22,447,838 | 48.80 | 277 | –6 | |
| Japan Socialist Party | 12,826,104 | 27.88 | 140 | –4 | |
| Democratic Socialist Party | 3,404,464 | 7.40 | 30 | +7 | |
| Komeitō | 2,472,371 | 5.38 | 25 | New | |
| Japanese Communist Party | 2,190,564 | 4.76 | 5 | 0 | |
| Other parties | 101,244 | 0.22 | 0 | – | |
| Independents | 2,553,989 | 5.55 | 9 | –3 | |
| Total | 45,996,574 | 100.00 | 486 | +19 | |
| Valid votes | 45,996,574 | 98.71 | |||
| Invalid/blank votes | 602,882 | 1.29 | |||
| Total votes | 46,599,456 | 100.00 | |||
| Registered voters/turnout | 62,992,796 | 73.98 | |||
| Source: Nohlen et al. | |||||
By prefecture
| Prefecture | Total seats |
Seats won | |||||
|---|---|---|---|---|---|---|---|
| LDP | JSP | DSP | Komeitō | JCP | Ind. | ||
| Aichi | 20 | 12 | 5 | 2 | 1 | ||
| Akita | 8 | 5 | 2 | 1 | |||
| Aomori | 7 | 4 | 3 | ||||
| Chiba | 13 | 10 | 3 | ||||
| Ehime | 9 | 7 | 1 | 1 | |||
| Fukui | 4 | 3 | 1 | ||||
| Fukuoka | 19 | 8 | 6 | 2 | 2 | 1 | |
| Fukushima | 12 | 8 | 3 | 1 | |||
| Gifu | 9 | 6 | 2 | 1 | |||
| Gunma | 10 | 7 | 3 | ||||
| Hiroshima | 12 | 8 | 3 | 1 | |||
| Hokkaido | 22 | 10 | 10 | 1 | 1 | ||
| Hyōgo | 19 | 8 | 5 | 4 | 2 | ||
| Ibaraki | 12 | 8 | 3 | 1 | |||
| Ishikawa | 6 | 5 | 1 | ||||
| Iwate | 8 | 5 | 3 | ||||
| Kagawa | 6 | 4 | 2 | ||||
| Kagoshima | 11 | 8 | 3 | ||||
| Kanagawa | 14 | 4 | 5 | 3 | 2 | ||
| Kōchi | 5 | 2 | 2 | 1 | |||
| Kumamoto | 10 | 8 | 2 | ||||
| Kyoto | 10 | 4 | 2 | 2 | 1 | 1 | |
| Mie | 9 | 7 | 2 | ||||
| Miyagi | 9 | 5 | 3 | 1 | |||
| Miyazaki | 6 | 4 | 1 | 1 | |||
| Nagano | 13 | 8 | 4 | 1 | |||
| Nagasaki | 9 | 6 | 3 | ||||
| Nara | 5 | 2 | 2 | 1 | |||
| Niigata | 15 | 9 | 6 | ||||
| Ōita | 7 | 5 | 2 | ||||
| Okayama | 10 | 5 | 4 | 1 | |||
| Osaka | 23 | 8 | 4 | 4 | 6 | 1 | |
| Saga | 5 | 3 | 2 | ||||
| Saitama | 13 | 6 | 5 | 1 | 1 | ||
| Shiga | 5 | 3 | 2 | ||||
| Shimane | 5 | 4 | 1 | ||||
| Shizuoka | 14 | 8 | 4 | 1 | 1 | ||
| Tochigi | 10 | 6 | 3 | 1 | |||
| Tokushima | 5 | 3 | 1 | 1 | |||
| Tokyo | 39 | 16 | 13 | 3 | 6 | 1 | |
| Tottori | 4 | 3 | 1 | ||||
| Toyama | 6 | 4 | 2 | ||||
| Wakayama | 6 | 5 | 1 | ||||
| Yamagata | 8 | 5 | 3 | ||||
| Yamaguchi | 9 | 6 | 2 | 1 | |||
| Yamanashi | 5 | 2 | 2 | 1 | |||
| Total | 486 | 277 | 140 | 30 | 25 | 5 | 9 |
References
- ↑ "統計局ホームページ/第27章 公務員・選挙". Archived from the original on 2015-02-15. Retrieved 2012-12-19.
| General elections | |
|---|---|
| Councillors elections | |
| Unified local elections | |
| Supreme Court retention elections |
|
| |
This article is issued from Wikipedia. The text is licensed under Creative Commons - Attribution - Sharealike. Additional terms may apply for the media files.