One third of City of Bradford Metropolitan District Council is elected each year, followed by one year without election.
Political control
From 1889 until 1974 Bradford was a county borough, independent from any county council. Under the Local Government Act 1972 it had its territory enlarged and became a metropolitan borough, with West Yorkshire County Council providing county-level services. The first election to the reconstituted city council was held in 1973, initially operating as a shadow authority before coming into its revised powers on 1 April 1974. West Yorkshire County Council was abolished in 1986 and Bradford became a unitary authority. Political control of the council since 1973 has been held by the following parties:[1]
| Party in control | Years | |
|---|---|---|
| Conservative | 1973–1980 | |
| Labour | 1980–1982 | |
| No overall control | 1982–1986 | |
| Labour | 1986–1988 | |
| No overall control | 1988–1990 | |
| Labour | 1990–2000 | |
| No overall control | 2000–2014 | |
| Labour | 2014–present | |
Leadership
The leaders of the council since 1979 have been:[2][3]
| Councillor | Party | From | To | |
|---|---|---|---|---|
| Brian Womersley | Conservative | 1979 | 1980 | |
| Derek Smith | Labour | 1980 | 1982 | |
| Tom Hall | Conservative | 1982 | 1984 | |
| Ronnie Farley | Conservative | 1984 | 1986 | |
| Phil Beeley | Labour | 1986 | 1988 | |
| Eric Pickles | Conservative | 1988 | 1990 | |
| Tommy Flanagan | Labour | 1990 | 1992 | |
| Gerry Sutcliffe | Labour | 1992 | 1994 | |
| Tony Cairns[4] | Labour | 1994 | 1997 | |
| John Ryan | Labour | 1997 | 1998 | |
| Ian Greenwood | Labour | 1998 | 2000 | |
| Margaret Eaton | Conservative | 2000 | 2006 | |
| Kris Hopkins | Conservative | 2006 | 25 May 2010 | |
| Ian Greenwood | Labour | 25 May 2010 | 6 May 2012 | |
| David Green | Labour | 22 May 2012 | 17 May 2016 | |
| Susan Hinchcliffe | Labour | 17 May 2016 | ||
Council elections
- 1973 City of Bradford Metropolitan District Council election
- 1975 City of Bradford Metropolitan District Council election
- 1976 City of Bradford Metropolitan District Council election
- 1978 City of Bradford Metropolitan District Council election
- 1979 City of Bradford Metropolitan District Council election
- 1980 City of Bradford Metropolitan District Council election
- 1982 City of Bradford Metropolitan District Council election
- 1983 City of Bradford Metropolitan District Council election
- 1984 City of Bradford Metropolitan District Council election
- 1986 City of Bradford Metropolitan District Council election
- 1987 City of Bradford Metropolitan District Council election
- 1988 City of Bradford Metropolitan District Council election
- 1990 City of Bradford Metropolitan District Council election
- 1991 City of Bradford Metropolitan District Council election
- 1992 City of Bradford Metropolitan District Council election
- 1994 City of Bradford Metropolitan District Council election
- 1995 City of Bradford Metropolitan District Council election
- 1996 City of Bradford Metropolitan District Council election
- 1998 City of Bradford Metropolitan District Council election
- 1999 City of Bradford Metropolitan District Council election
- 2000 City of Bradford Metropolitan District Council election
- 2002 City of Bradford Metropolitan District Council election
- 2003 City of Bradford Metropolitan District Council election
- 2004 City of Bradford Metropolitan District Council election
- 2006 City of Bradford Metropolitan District Council election
- 2007 City of Bradford Metropolitan District Council election
- 2008 City of Bradford Metropolitan District Council election
- 2010 City of Bradford Metropolitan District Council election
- 2011 City of Bradford Metropolitan District Council election
- 2012 City of Bradford Metropolitan District Council election
- 2014 City of Bradford Metropolitan District Council election
- 2015 City of Bradford Metropolitan District Council election
- 2016 City of Bradford Metropolitan District Council election
- 2018 City of Bradford Metropolitan District Council election
- 2019 City of Bradford Metropolitan District Council election
- 2021 City of Bradford Metropolitan District Council election
- 2022 City of Bradford Metropolitan District Council election
District result maps
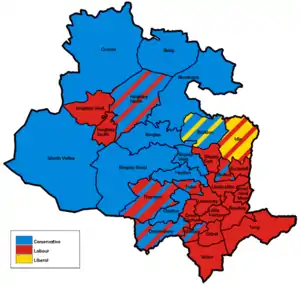 1980 results map
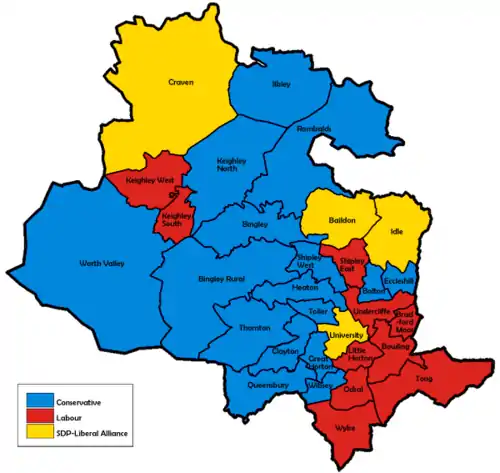 1982 results map
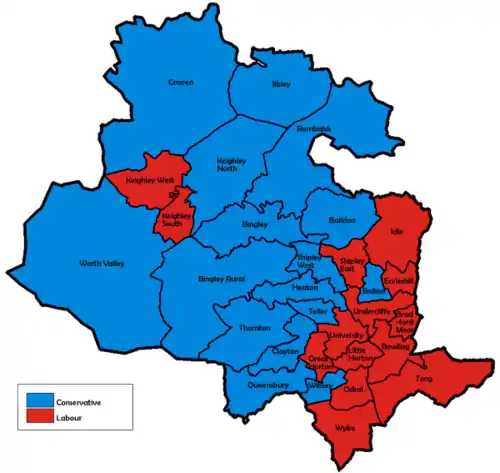 1983 results map
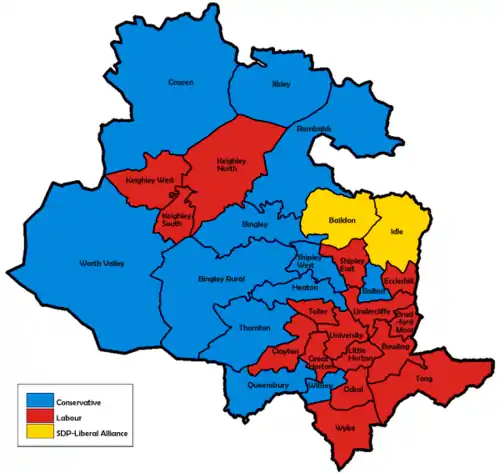 1984 results map
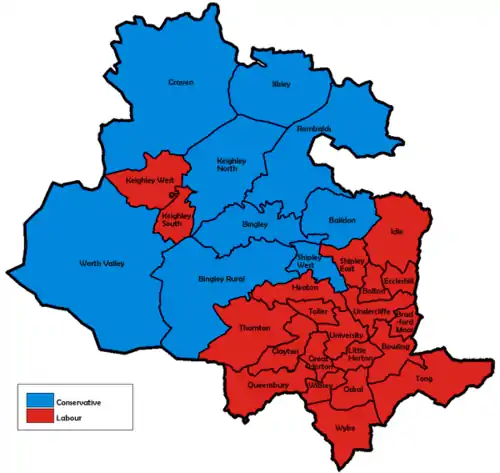 1986 results map
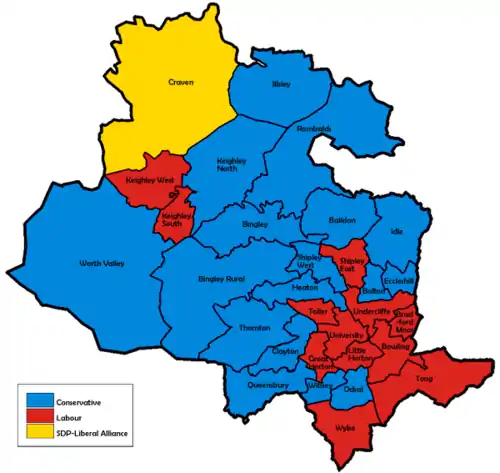 1987 results map
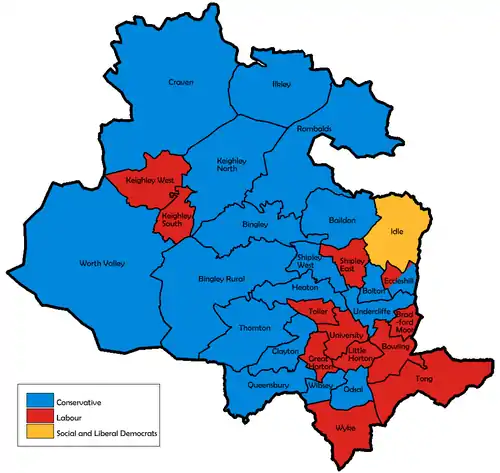 1988 results map
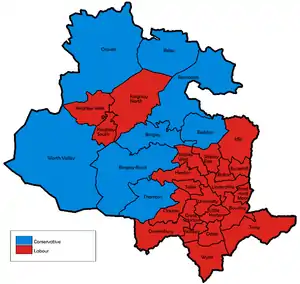 1990 results map
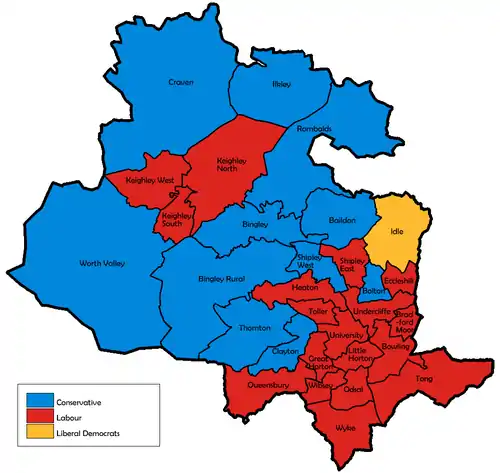 1991 results map
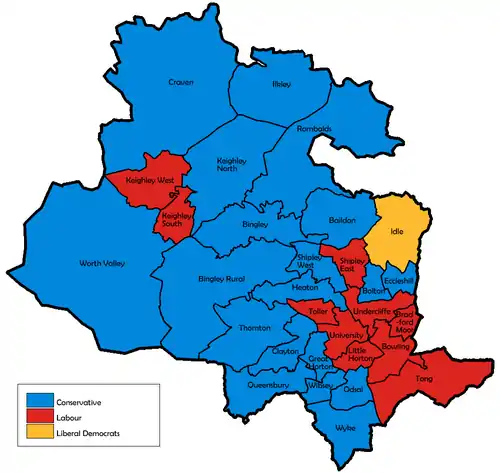 1992 results map
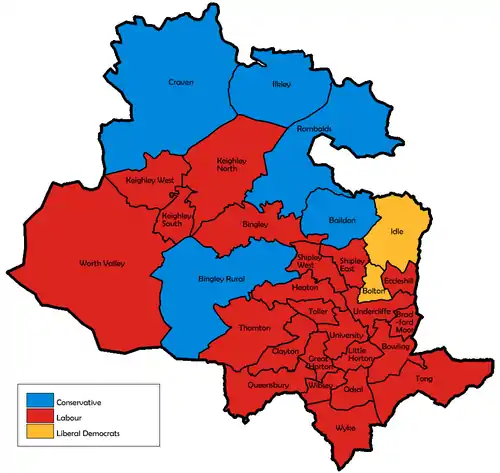 1994 results map
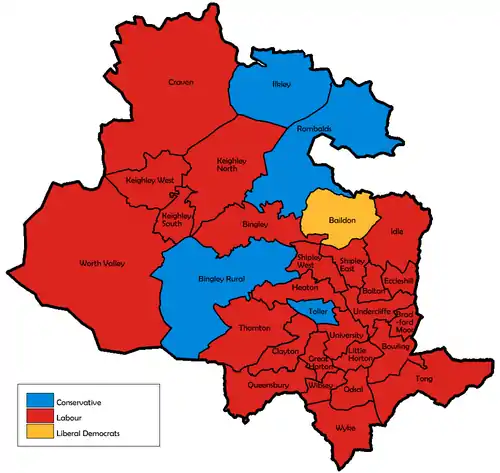 1995 results map
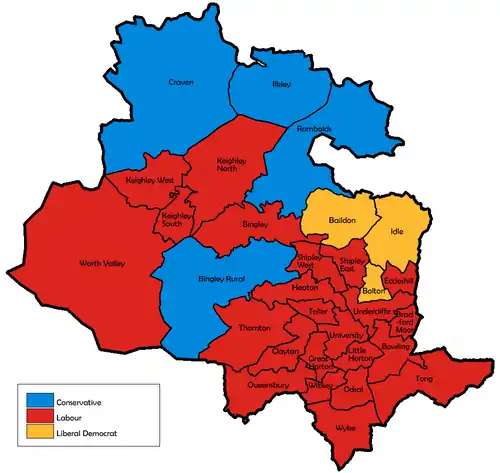 1996 results map
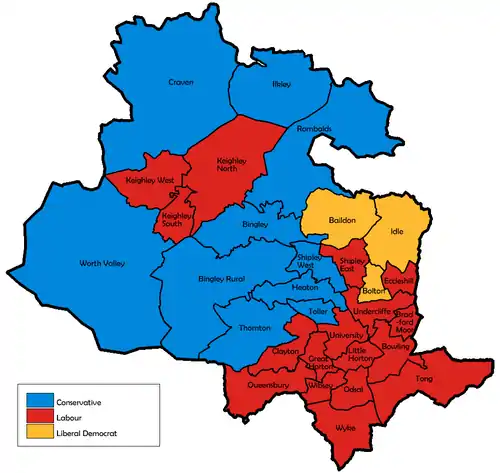 1998 results map
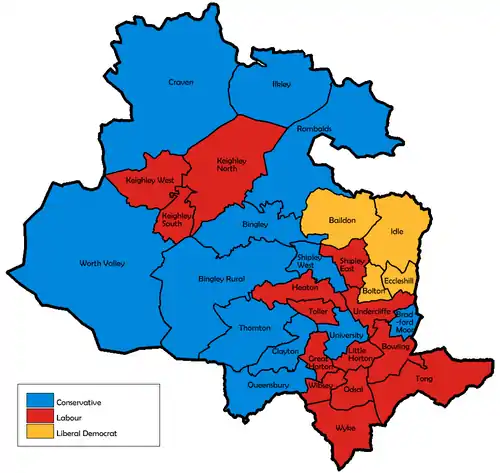 1999 results map
 2000 results map
 2002 results map
 2003 results map
 2004 results map
 2006 results map
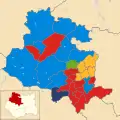 2007 results map
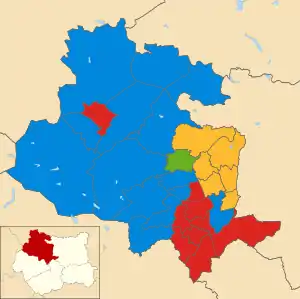 2008 results map
 2010 results map
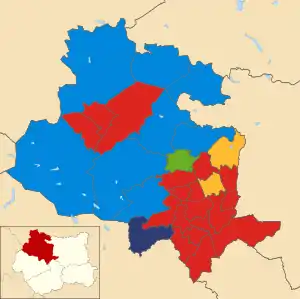 2011 results map
 2012 results map
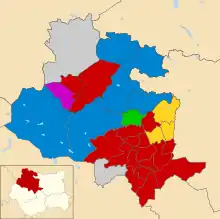 2014 results map
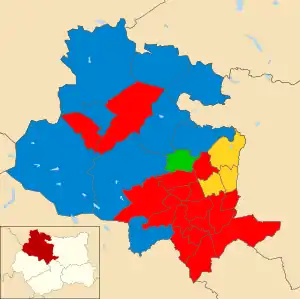 2015 results map
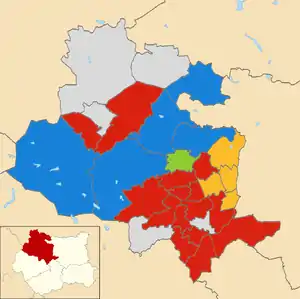 2016 results map
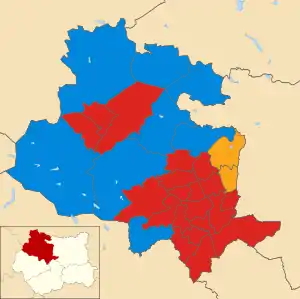 2018 results map
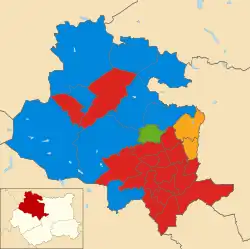 2019 results map
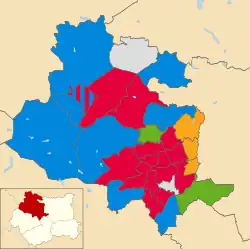 2021 results map
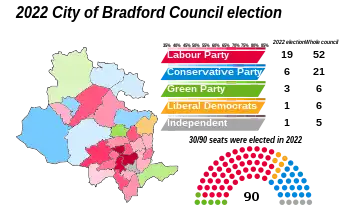 2022 results map
By-election results
| Party | Candidate | Votes | % | ±% | |
|---|---|---|---|---|---|
| Conservative | 2,041 | 50.4 | |||
| Labour | 1,808 | 44.6 | |||
| Liberal Democrats | 202 | 5.0 | |||
| Majority | 233 | 5.8 | |||
| Turnout | 4,051 | 34.8 | |||
| Conservative gain from Labour | Swing | ||||
| Party | Candidate | Votes | % | ±% | |
|---|---|---|---|---|---|
| Labour | 1,263 | 36.8 | -6.7 | ||
| Conservative | 1,222 | 35.6 | -0.6 | ||
| Green | 667 | 19.4 | +8.0 | ||
| Liberal Democrats | 284 | 8.3 | -0.6 | ||
| Majority | 41 | 1.2 | |||
| Turnout | 3,436 | ||||
| Labour hold | Swing | ||||
| Party | Candidate | Votes | % | ±% | |
|---|---|---|---|---|---|
| Liberal Democrats | 1,614 | 52.3 | -1.0 | ||
| Conservative | 1,077 | 34.9 | -0.7 | ||
| Labour | 372 | 12.1 | +1.0 | ||
| Independent | 22 | 0.7 | +0.7 | ||
| Majority | 537 | 17.4 | |||
| Turnout | 3,085 | 24.6 | |||
| Liberal Democrats hold | Swing | ||||
| Party | Candidate | Votes | % | ±% | |
|---|---|---|---|---|---|
| Labour | 1,227 | 60.2 | +18.5 | ||
| Conservative | 538 | 26.4 | -14.2 | ||
| Liberal Democrats | 272 | 13.4 | +4.3 | ||
| Majority | 689 | 33.8 | |||
| Turnout | 2,037 | 17.0 | |||
| Labour hold | Swing | ||||
| Party | Candidate | Votes | % | ±% | |
|---|---|---|---|---|---|
| Labour | Tony Niland | 1,014 | 44.0 | -8.4 | |
| Conservative | Zameer Shah | 777 | 33.7 | +5.4 | |
| Liberal Democrats | Rupert Oliver | 473 | 20.5 | +8.6 | |
| Majority | 237 | 10.3 | |||
| Turnout | 2,264 | 18.6 | |||
| Labour hold | Swing | ||||
| Party | Candidate | Votes | % | ±% | |
|---|---|---|---|---|---|
| Labour | 3,217 | 45.5 | +16.0 | ||
| Conservative | 2,744 | 38.8 | -15.8 | ||
| Liberal Democrats | 892 | 12.6 | -4.6 | ||
| Independent | 203 | 2.9 | -2.0 | ||
| Asian | 13 | 0.2 | +0.2 | ||
| Majority | 473 | 6.7 | |||
| Turnout | 7,069 | 53.3 | |||
| Labour hold | Swing | ||||
| Party | Candidate | Votes | % | ±% | |
|---|---|---|---|---|---|
| Conservative | Juliette Kinsey | 1,576 | 65.2 | -0.7 | |
| Labour | James Newton | 642 | 26.6 | +4.7 | |
| Liberal Democrats | James Stewart | 150 | 6.2 | -2.4 | |
| Green | John Love | 50 | 2.1 | -1.9 | |
| Majority | 934 | 38.6 | |||
| Turnout | 2,418 | 20.0 | |||
| Conservative hold | Swing | ||||
| Party | Candidate | Votes | % | ±% | |
|---|---|---|---|---|---|
| Labour | Liz Devlin | 926 | 36.9 | -0.9 | |
| Conservative | Richard Milczanowski | 764 | 30.4 | +8.3 | |
| Liberal Democrats | Paul Michell | 692 | 27.6 | +10.5 | |
| Green | Derek Curtis | 129 | 5.1 | -1.5 | |
| Majority | 162 | 6.5 | |||
| Turnout | 2,511 | 23.4 | |||
| Labour gain from Conservative | Swing | ||||
| Party | Candidate | Votes | % | ±% | |
|---|---|---|---|---|---|
| Conservative | Andrew Naylor | 1,304 | 57.0 | +13.4 | |
| Labour | Steven Carter | 669 | 29.2 | +10.7 | |
| Liberal Democrats | Frances McAulay | 315 | 13.8 | -3.7 | |
| Majority | 635 | 27.8 | |||
| Turnout | 2,288 | 18.7 | |||
| Conservative hold | Swing | ||||
| Party | Candidate | Votes | % | ±% | |
|---|---|---|---|---|---|
| Labour | Angela Sinfield | 1,819 | 47.0 | +22.2 | |
| BNP | Ian Dawson | 1,216 | 31.4 | +2.3 | |
| Conservative | Lionel Lockley | 627 | 16.2 | -3.8 | |
| Liberal Democrats | Victoria Salmons | 208 | 5.4 | -4.8 | |
| Majority | 603 | 15.6 | |||
| Turnout | 3,870 | 35.1 | |||
| Labour gain from BNP | Swing | ||||
| Party | Candidate | Votes | % | ±% | |
|---|---|---|---|---|---|
| Conservative | John Allan Pennington | 1,949 | |||
| Labour | Andrew David Mawson | 689 | |||
| Liberal Democrats | Jean Taylor | 332 | |||
| Green | Arthur Albert John Arnold | 175 | |||
| Democratic Nationalists | Jim Lewthwaite | 61 | |||
| UKIP | Jason Paul Smith | 49 | |||
| Majority | 1,260 | ||||
| Turnout | 3,262 | 24.99 | |||
| Party | Candidate | Votes | % | ±% | |
|---|---|---|---|---|---|
| Conservative | Russell Brown | 1,020 | |||
| Labour | Mark Bernard Curtis | 697 | |||
| Green | Robert Edward Swindells | 235 | |||
| Liberal Democrats | Sharon Catherine Purvis | 180 | |||
| Majority | 323 | ||||
| Turnout | 2,139 | 19.46 | |||
| Party | Candidate | Votes | % | ±% | |
|---|---|---|---|---|---|
| Labour | Abdul Jabar | 1,993 | 58.6 | -1.1 | |
| Conservative | Mehrban Hussain | 705 | 20.7 | -5.0 | |
| Liberal Democrats | Mary Slingsby | 337 | 9.9 | -3.3 | |
| UKIP | Jason Paul Smith | 294 | 8.6 | (+8.6) | |
| Green | Celia Ruth Hickson | 73 | 2.1 | (+2.1) | |
| Majority | 1,288 | 37.9 | +3.9 | ||
| Turnout | 3,402 | 27.1 | -8.5 | ||
| Labour hold | Swing | 3.9 | |||
| Party | Candidate | Votes | % | ±% | |
|---|---|---|---|---|---|
| Conservative | Jackie Whiteley | 1,353 | 54.03 | −6.77 | |
| Labour | David Green | 485 | 19.37 | +0.63 | |
| Green | Janet Souyave | 320 | 12.78 | −2.47 | |
| Liberal Democrats | Paul Treadwell | 222 | 8.87 | +3.66 | |
| UKIP | Samuel Fletcher | 124 | 4.95 | N/A | |
| Majority | 868 | 34.66 | |||
| Turnout | 2,516 | 27.51 | −13.02 | ||
| Conservative hold | Swing | ||||
| Party | Candidate | Votes | % | ±% | |
|---|---|---|---|---|---|
| Labour | Joanne Lisa Sharp | 1,207 | 51 | ||
| UKIP | Jason Paul Smith | 655 | 27 | ||
| Conservative | Richard Ian Sheard | 451 | 19 | ||
| Liberal Democrats | Angharad Elizabeth Griffiths | 70 | 3 | ||
| Majority | 552 | 23 | |||
| Turnout | 2,383 | 23 | |||
| Labour hold | Swing | ||||
| Party | Candidate | Votes | % | ±% | |
|---|---|---|---|---|---|
| Conservative | Andrew John Senior | 2,175 | 56 | ||
| Independent | Jason Paul Smith | 732 | 19 | ||
| Labour | Mobeen Hussain | 697 | 18 | ||
| Green | Eithne Mary Dodwell | 143 | 4 | ||
| Liberal Democrats | Mary Whitrick | 135 | 3 | ||
| Majority | 1,443 | 37 | |||
| Turnout | 3,882 | 32 | |||
| Conservative hold | Swing | ||||
| Party | Candidate | Votes | % | ±% | |
|---|---|---|---|---|---|
| Liberal Democrats | Rachel Sunderland | 1,733 | 51.3 | ||
| Labour | Amriz Hussain | 1,153 | 34.1 | ||
| Conservative | Ranbir Singh | 418 | 12.4 | ||
| Green | Phil Worsnop | 73 | 2.2 | ||
| Majority | 580 | 17.2 | |||
| Turnout | 3,377 | ||||
| Liberal Democrats gain from Labour | Swing | ||||
References
- ↑ "Compositions calculator". The Elections Centre. Retrieved 10 August 2022.
- ↑ "Council minutes". City of Bradford Metropolitan District Council. Retrieved 12 August 2022.
- ↑ "Bradford Timeline". Retrieved 12 August 2022.
- ↑ Young, Chris (15 February 2021). "Tributes paid to former Council leader and Lord Mayor Tony Cairns". Telegraph and Argus. Retrieved 12 August 2022.
- ↑ "Archived copy" (PDF). Archived from the original (PDF) on 30 September 2011. Retrieved 11 November 2011.
{{cite web}}: CS1 maint: archived copy as title (link) - ↑ "Archived copy" (PDF). Archived from the original (PDF) on 3 April 2012. Retrieved 11 November 2011.
{{cite web}}: CS1 maint: archived copy as title (link) - ↑ Wharfedale Ward By-Election, 2017. Bradford City Council.
- ↑ Wibsey Ward By-Election, 2017. Bradford City Council.
- ↑ Queensbury Ward By-Election, 2017. Bradford City Council.
- ↑ "Local Elections Archive Project — Bolton and Undercliffe Ward". www.andrewteale.me.uk. Retrieved 18 April 2022.
External links
| Mayor | |
|---|---|
| Bradford | |
| Calderdale | |
| Kirklees | |
| Leeds |
|
| Wakefield | |
| West Yorkshire CC | |
| West Riding CC | |
| |